Fig. 13.
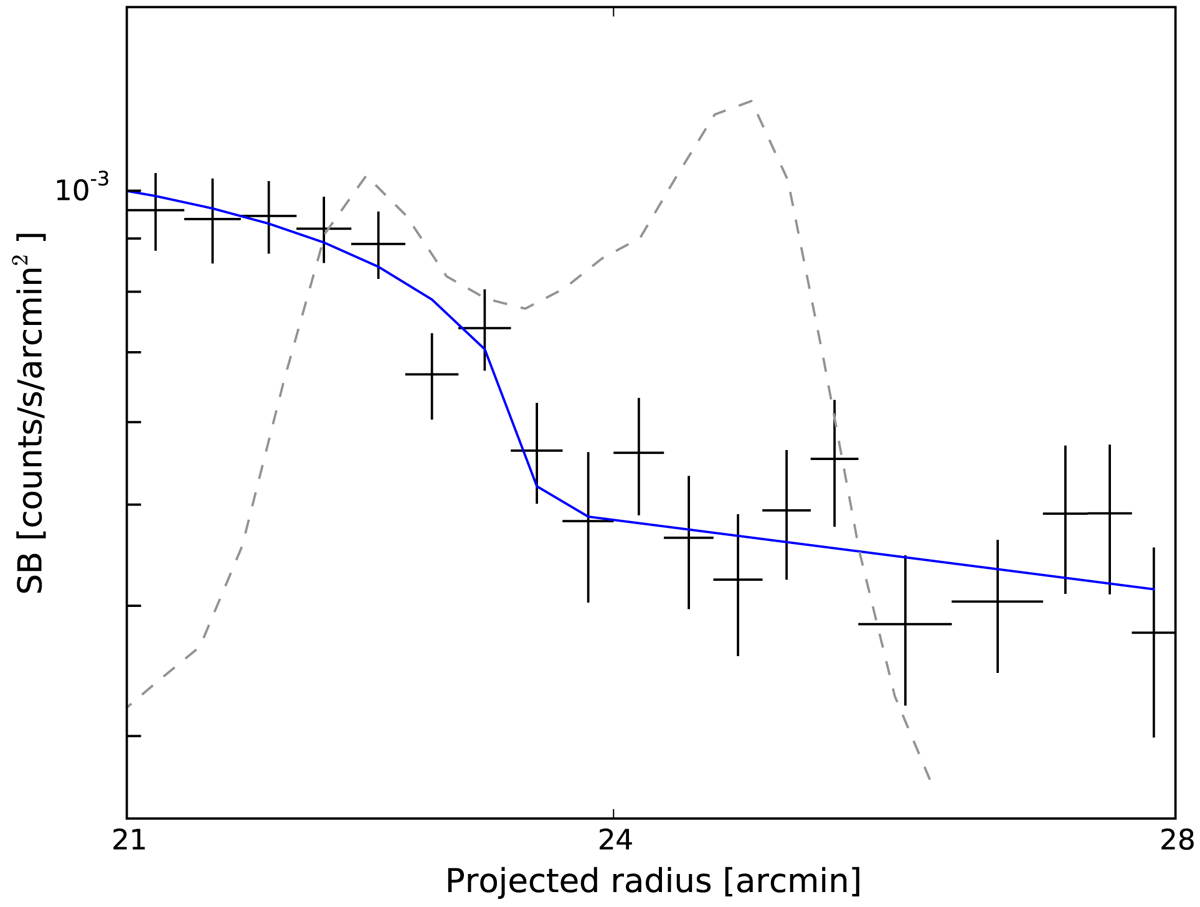
Radial X-ray surface brightness profile across the western radio relic in the 0.3–2.0 keV band using XMM-Newton observations. The profile is corrected for vignetting and background level, and point sources have been removed. The solid blue curve is the best-fit model and the gray dashed line is the VLA scaled radio emission. The data were rebinned to reach a minimum S/N of four and C-stat/d.o.f. ∼ 1.2.
Current usage metrics show cumulative count of Article Views (full-text article views including HTML views, PDF and ePub downloads, according to the available data) and Abstracts Views on Vision4Press platform.
Data correspond to usage on the plateform after 2015. The current usage metrics is available 48-96 hours after online publication and is updated daily on week days.
Initial download of the metrics may take a while.