Fig. 12.
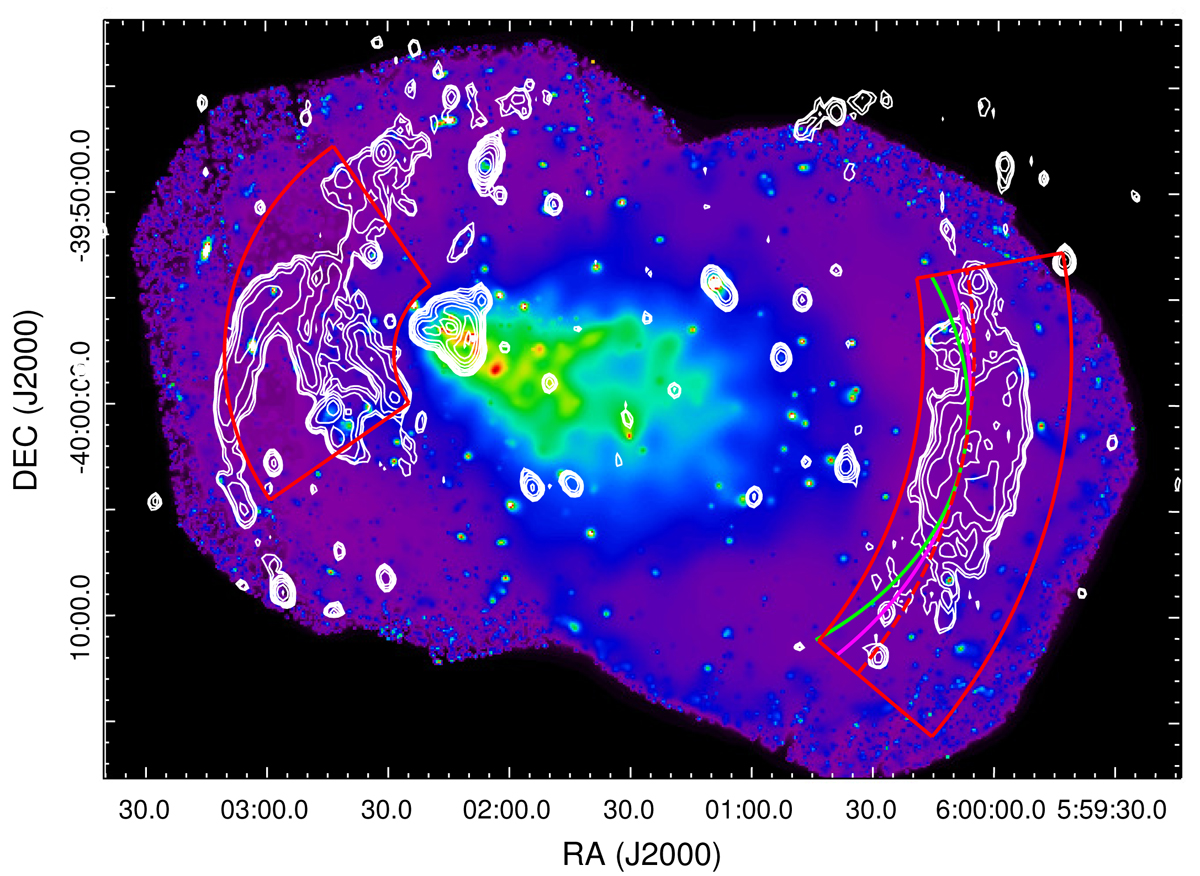
XMM-Newton image in the 0.5–10 keV band of A3376. The white contours correspond to VLA radio observations. The red sectors are used to extract the X-ray SB profile in the E and W directions. The dashed red line represents the circular (ε = 0) shaped sector used for the SB profiles. The magenta and green lines are the elliptical shaped sectors with ε = 0.60 and ε = 0.73, respectively.
Current usage metrics show cumulative count of Article Views (full-text article views including HTML views, PDF and ePub downloads, according to the available data) and Abstracts Views on Vision4Press platform.
Data correspond to usage on the plateform after 2015. The current usage metrics is available 48-96 hours after online publication and is updated daily on week days.
Initial download of the metrics may take a while.