Fig. 8.
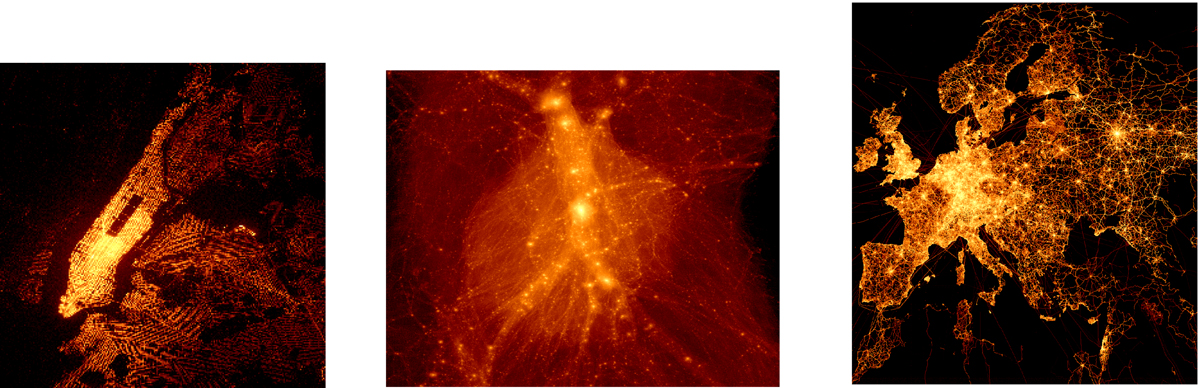
Examples of density maps created from big datasets. Left: drop-off locations of the Yellow cab taxies in New York City between 2009 and 2015. In total ∼1 billion GPS coordinates are plotted. Middle: density plot of particle position from the Aquarius pure dark matter simulations (Springel et al. 2008, Aquarius A level 2), ∼0.6 billion particles. Right: open street map GPS data, showing ∼2 billion coordinates.
Current usage metrics show cumulative count of Article Views (full-text article views including HTML views, PDF and ePub downloads, according to the available data) and Abstracts Views on Vision4Press platform.
Data correspond to usage on the plateform after 2015. The current usage metrics is available 48-96 hours after online publication and is updated daily on week days.
Initial download of the metrics may take a while.