Fig. 5.
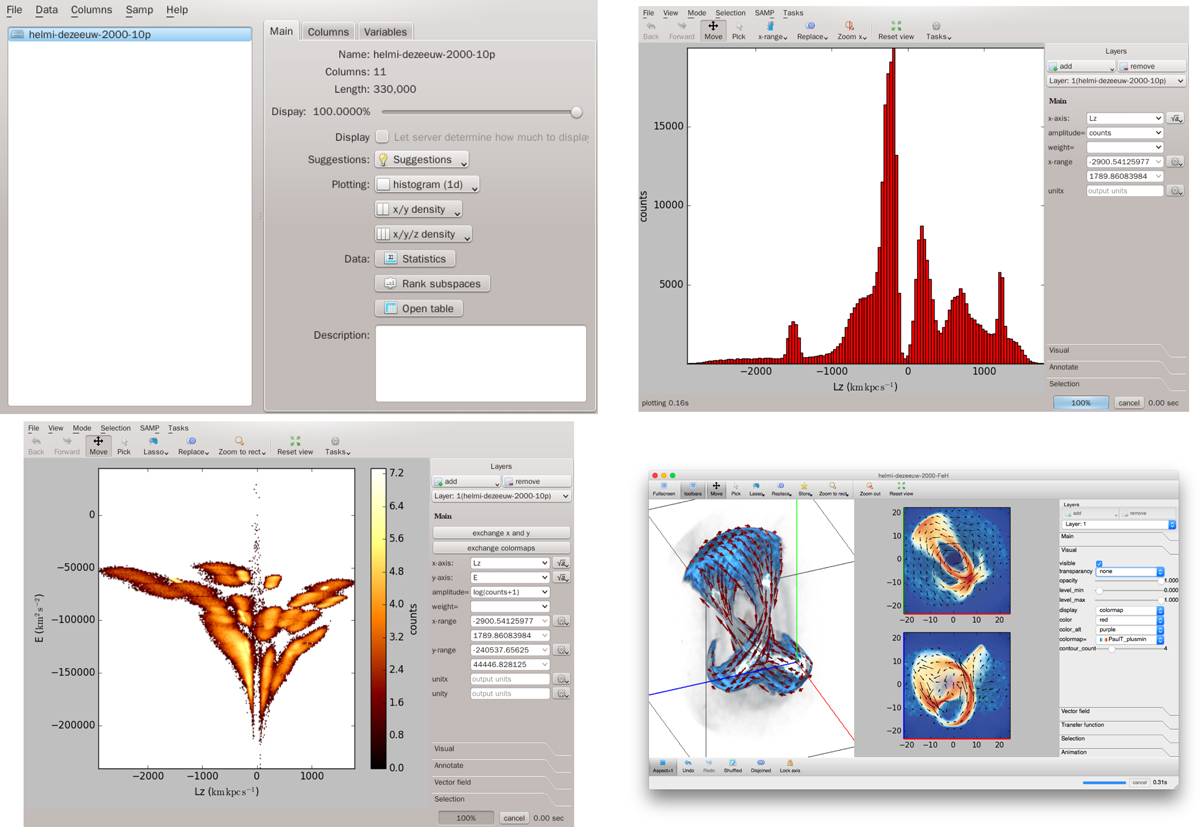
Top left: a screenshot of main application window. On the left it shows the open tables, and on the right the meta-data and operations that can be performed on the table. Top right: one dimensional histogram showing the Lz distribution of our example dataset. Bottom left: a two dimensional plotting window, showing E versus Lz. Bottom right: a volume rendering of a stream in our example dataset in Cartesian coordinates. The mean velocity field is also displayed with the help of vectors.
Current usage metrics show cumulative count of Article Views (full-text article views including HTML views, PDF and ePub downloads, according to the available data) and Abstracts Views on Vision4Press platform.
Data correspond to usage on the plateform after 2015. The current usage metrics is available 48-96 hours after online publication and is updated daily on week days.
Initial download of the metrics may take a while.