Fig. 4.
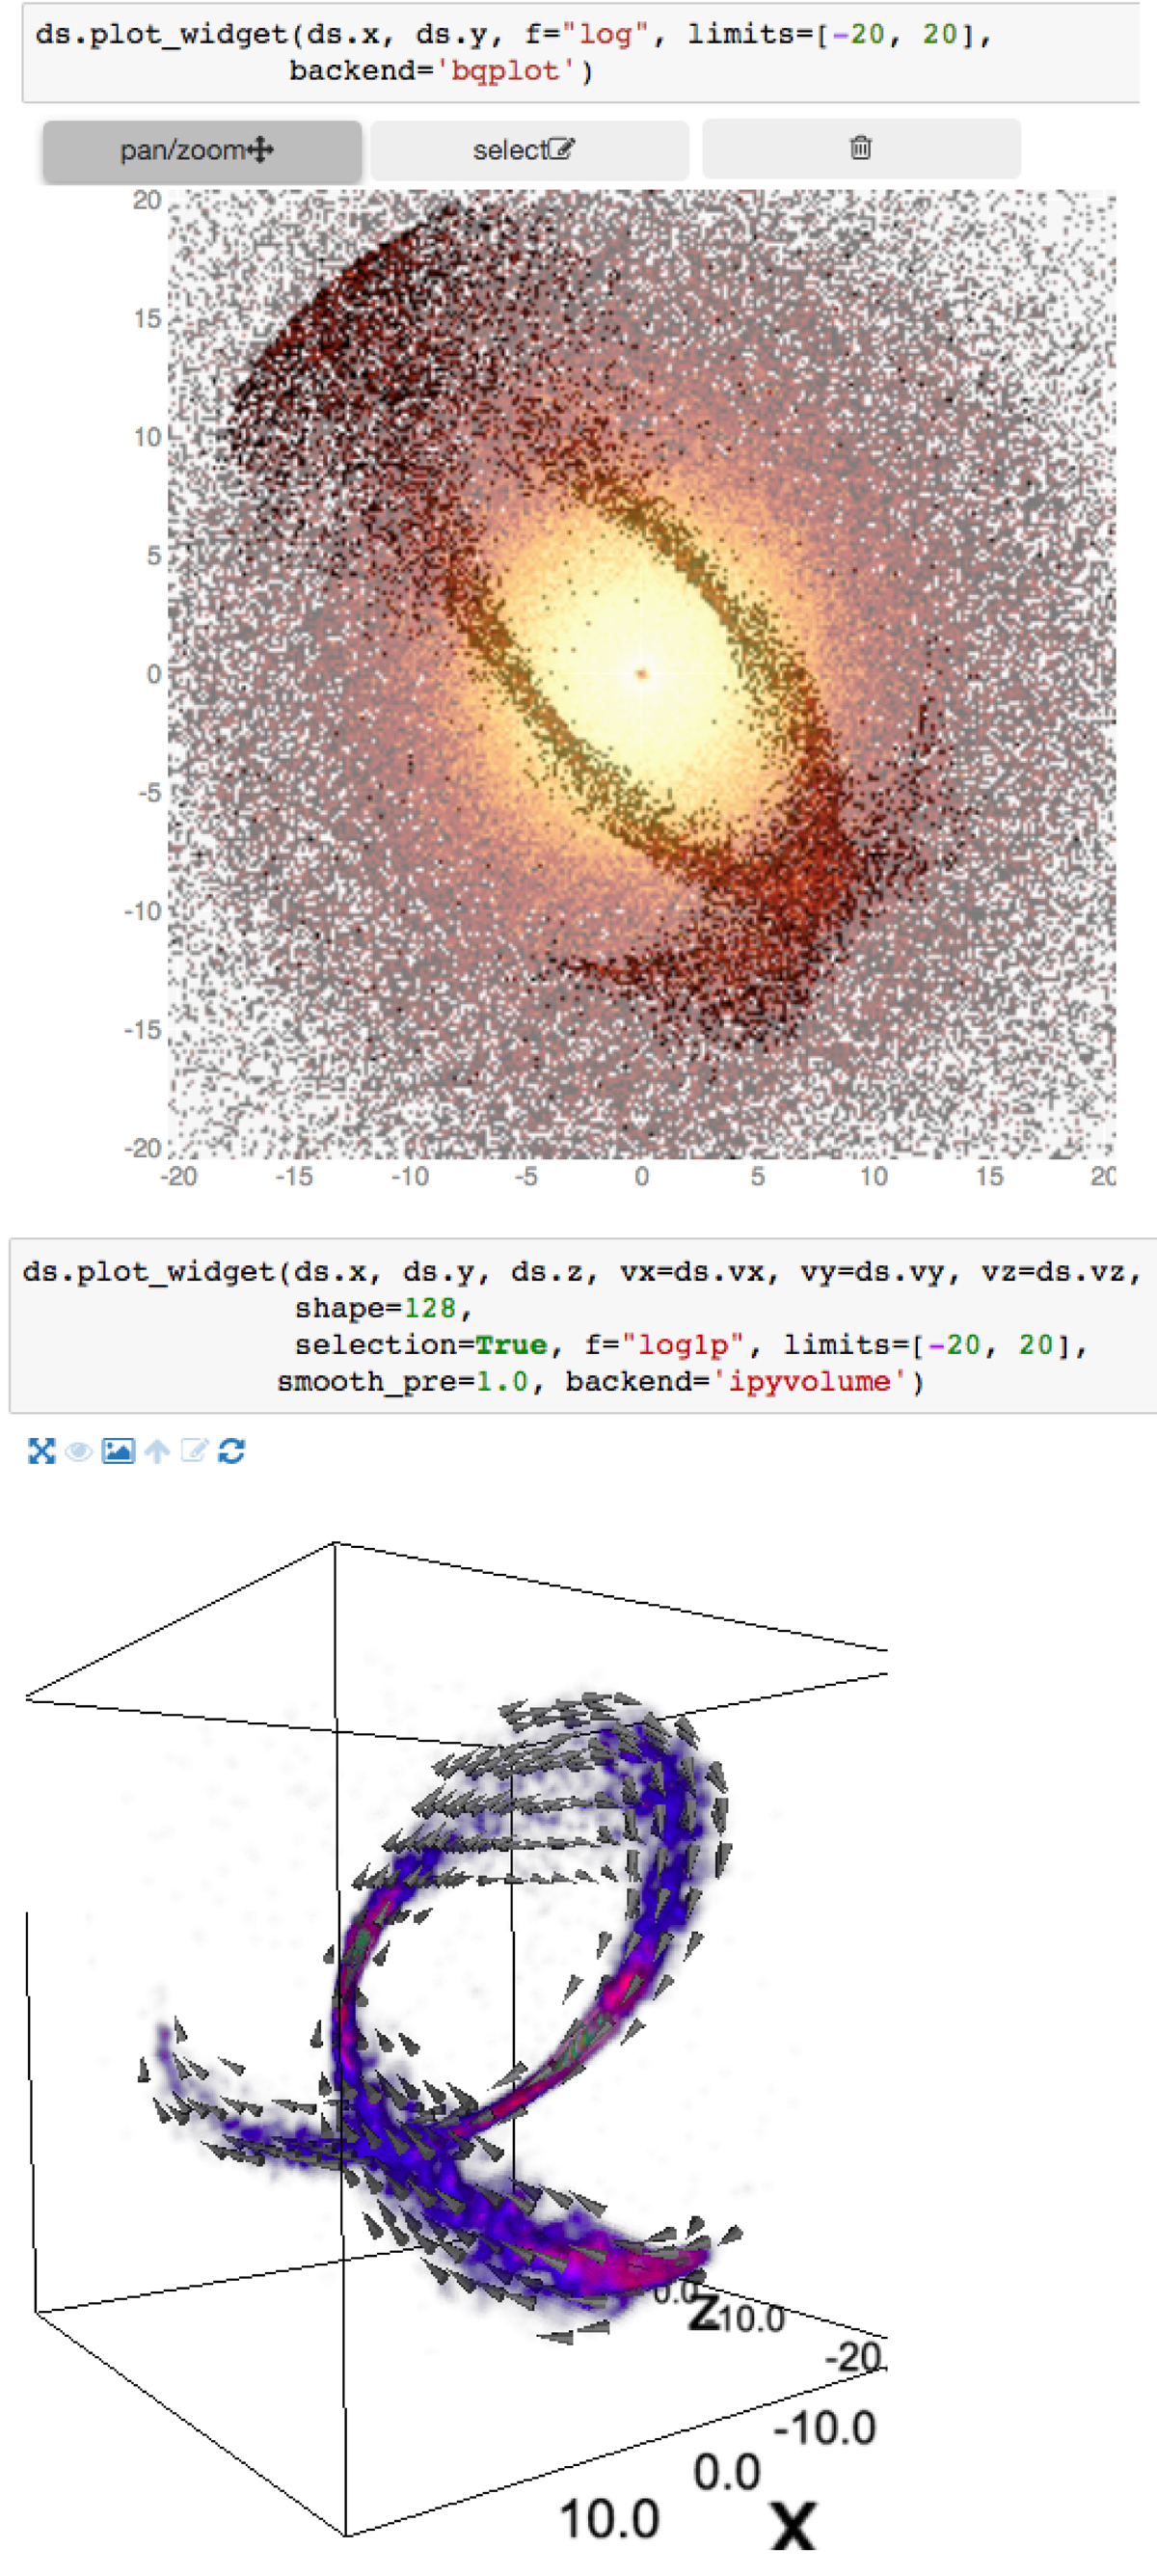
Top: screenshot of a Jupyter notebook using the widget back-end to visualize the dataset interactively using panning, zooming and selection with the mouse. The back-end used here is bqplot. Bottom: a 3d visualization using the ipyvolume backend, showing the stream discussed before, where the vector visualize the mean velocity. An interactive version of this visualization is available online.
Current usage metrics show cumulative count of Article Views (full-text article views including HTML views, PDF and ePub downloads, according to the available data) and Abstracts Views on Vision4Press platform.
Data correspond to usage on the plateform after 2015. The current usage metrics is available 48-96 hours after online publication and is updated daily on week days.
Initial download of the metrics may take a while.