Fig. 3.
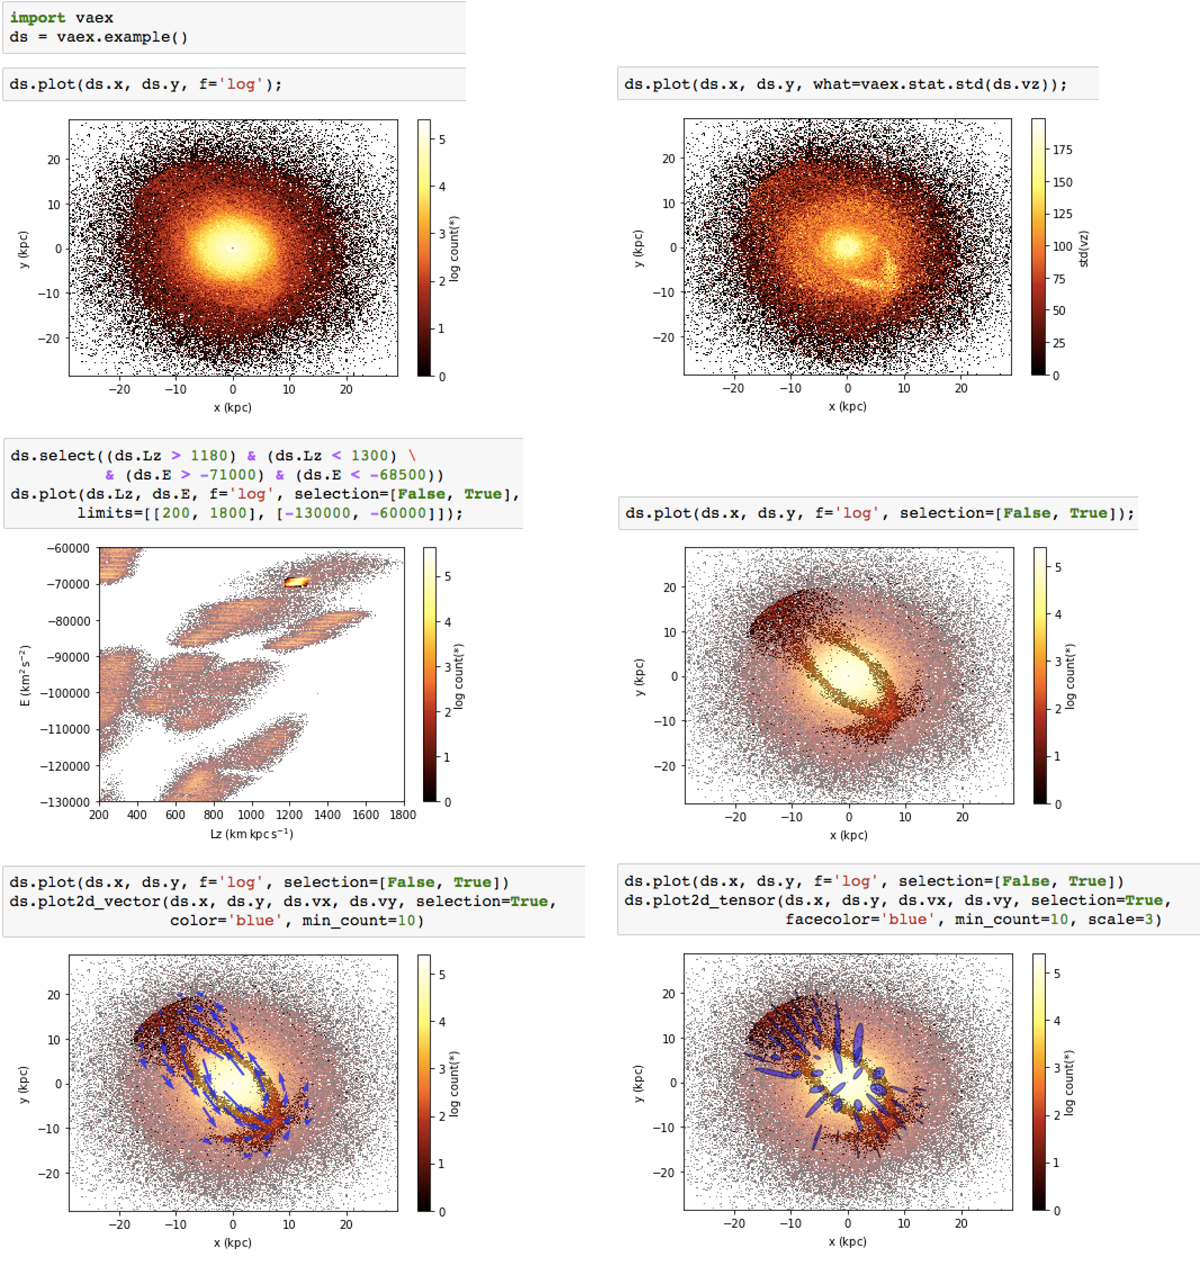
Example of two dimensional visualization for the vaex-viz package. Top left: two dimensional histogram, colour coded by a colour map visualizing the counts in each bin. Top right: similar to the left, but showing the standard deviation in each bin. Middle left: a zoom-in of the E versus Lz space, where a rectangular region is selected using vaex’ selection mechanism. The underlying visualization of all the data is slightly faded out to highlight the selection. Middle right: similar to the top left, but displaying the both the full dataset and the selection, where the selected rectangular region corresponds to a satellite that is not fully phase mixed. Bottom left: similar as the middle right plot but overlaying the mean velocity of the selection using vectors. Bottom right: similar as the bottom left, except now overlaying the velocity dispersion tensor represented by ellipses.
Current usage metrics show cumulative count of Article Views (full-text article views including HTML views, PDF and ePub downloads, according to the available data) and Abstracts Views on Vision4Press platform.
Data correspond to usage on the plateform after 2015. The current usage metrics is available 48-96 hours after online publication and is updated daily on week days.
Initial download of the metrics may take a while.