Fig. 2.
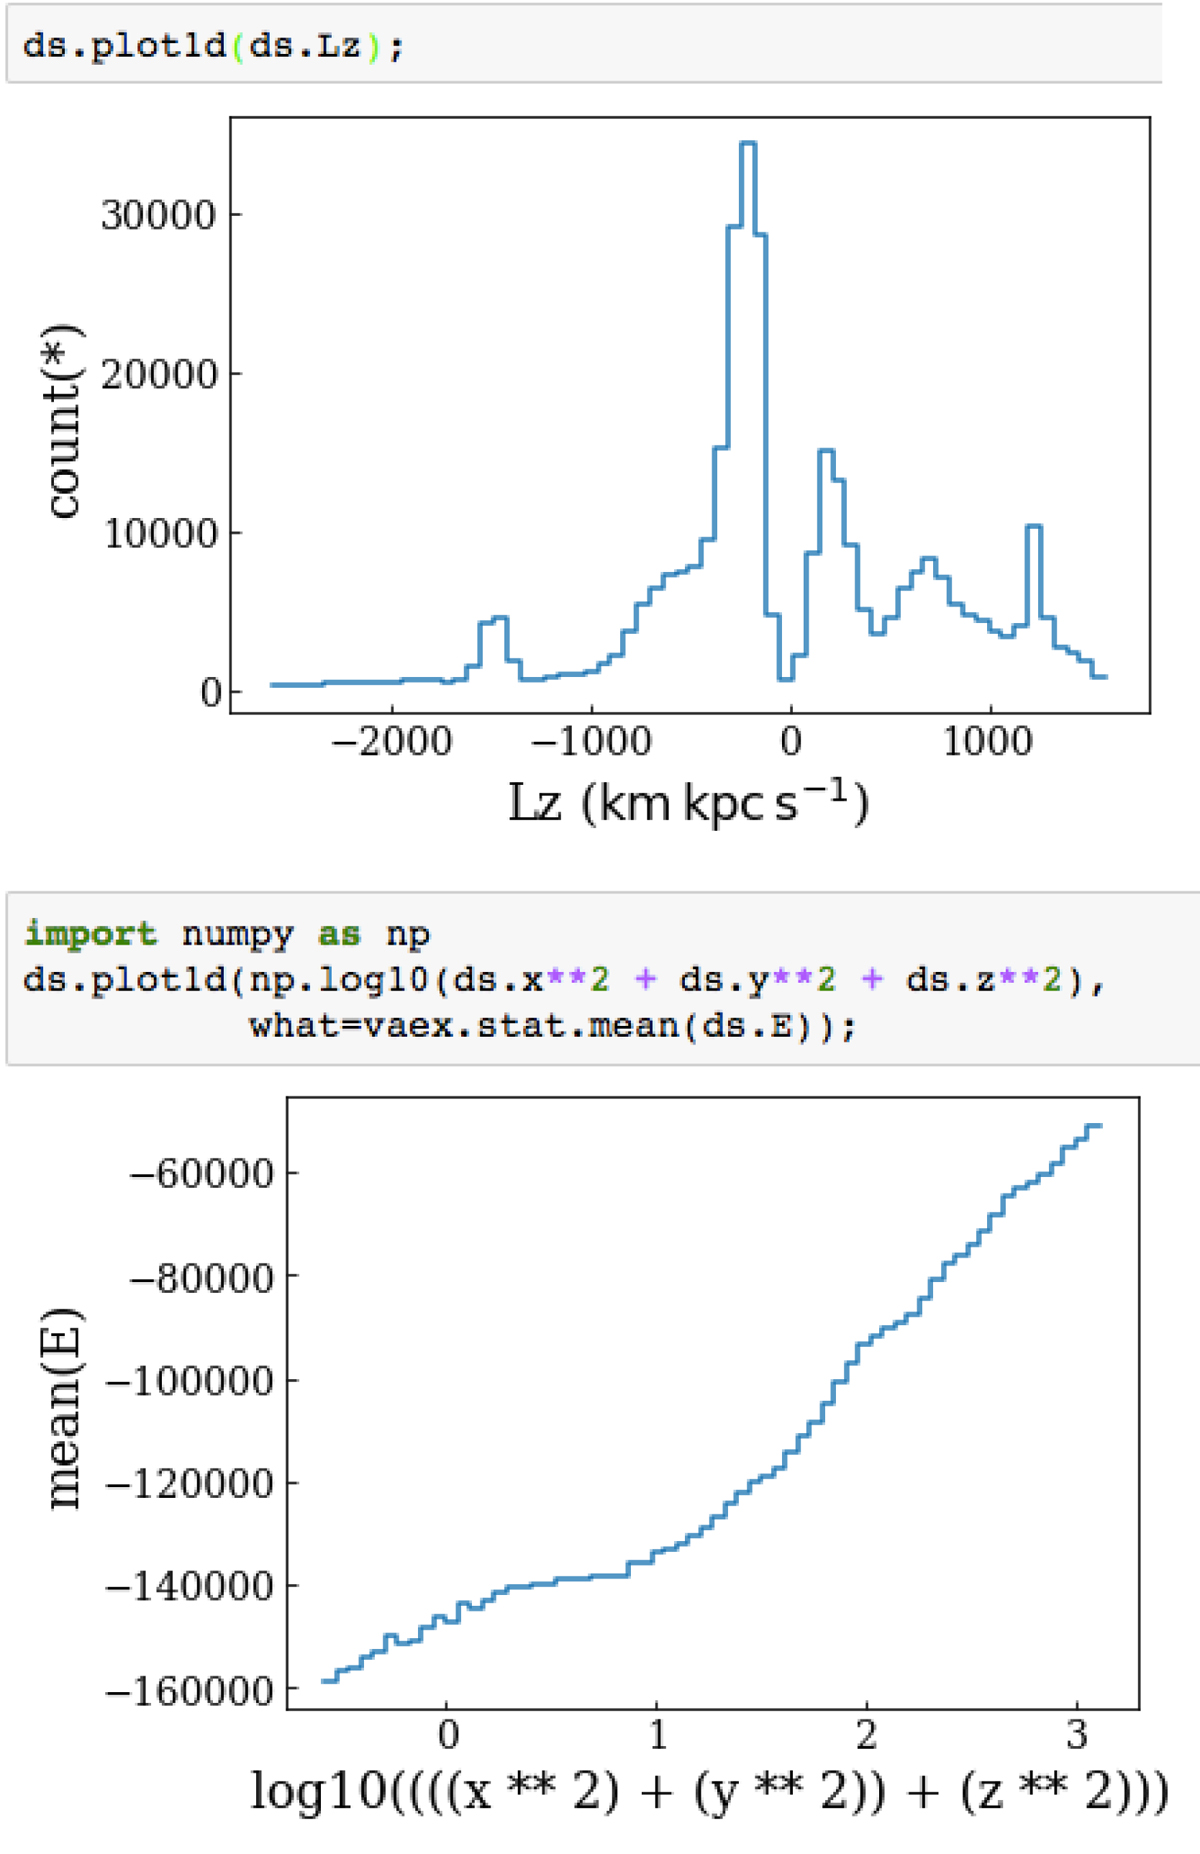
Example of one dimensional visualization for the vaex-viz package. Top: histogram of Lz, the angular momentum in the z direction. Because the units are specified in the data file for this column, it will be included in the labelling of the x axis by default. Bottom: similar as above, but showing the mean of the energy E in each bin.
Current usage metrics show cumulative count of Article Views (full-text article views including HTML views, PDF and ePub downloads, according to the available data) and Abstracts Views on Vision4Press platform.
Data correspond to usage on the plateform after 2015. The current usage metrics is available 48-96 hours after online publication and is updated daily on week days.
Initial download of the metrics may take a while.