Fig. 1.
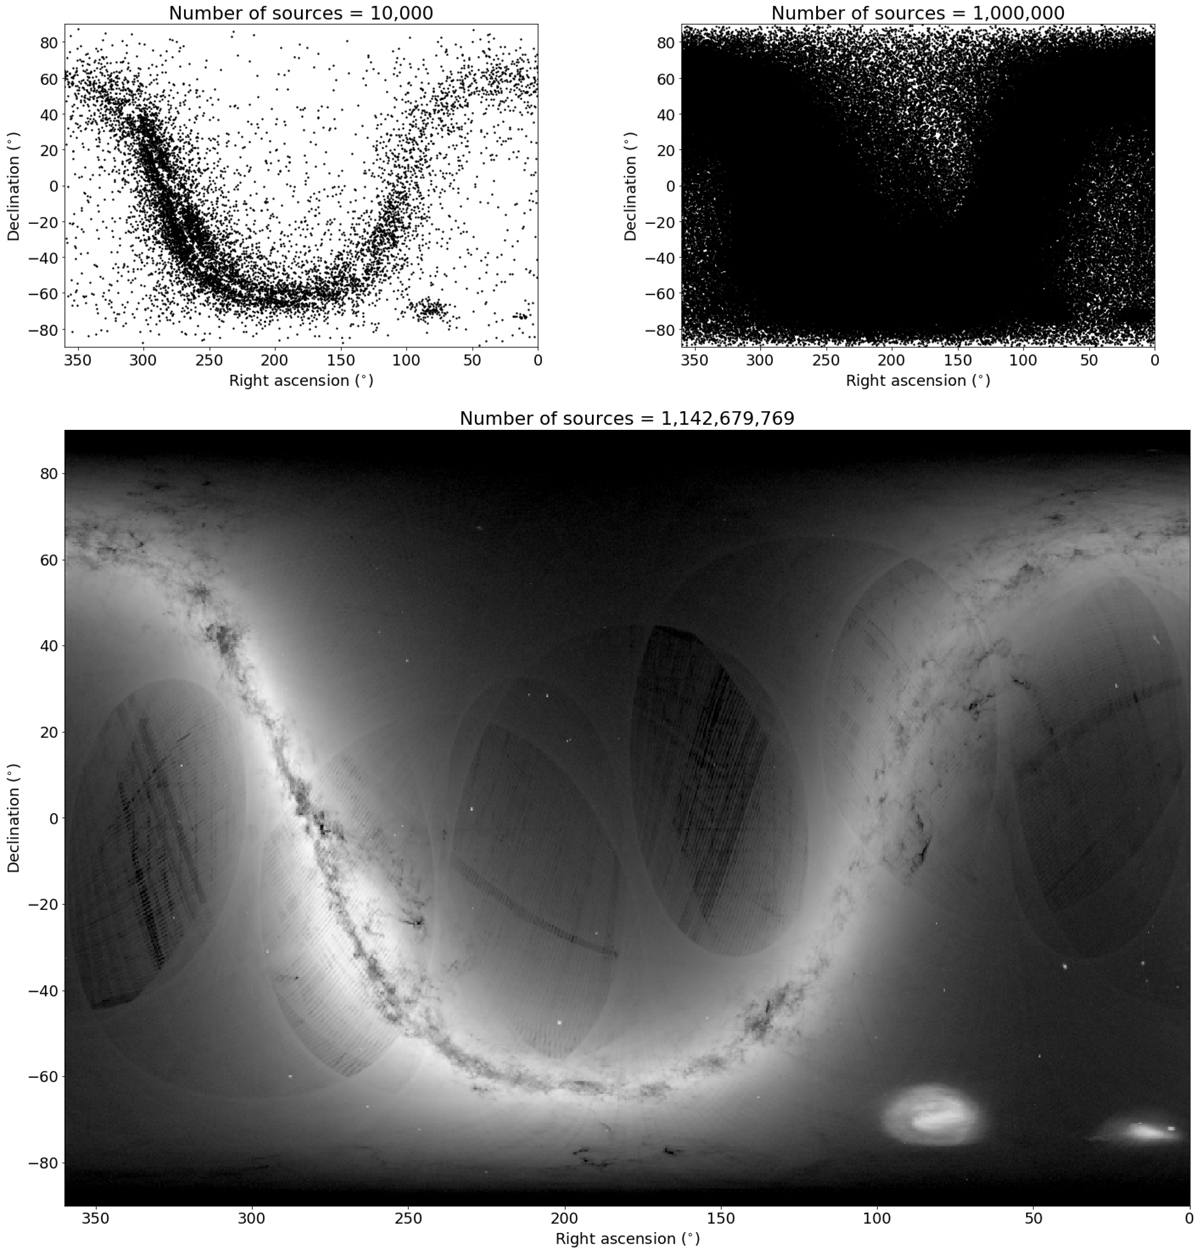
Comparison between scatter and density plots when trying to visualize the sky as observed by Gaia DR1. Top left: a scatter plot showing 10 000 sources in Equatorial coordinates, which does reveal some structure in the disk. Top right: idem, with 1 000 000 sources, hiding almost any structure present in the data. Bottom: a density plot with 1 142 679 769 sources, where the logarithm of the density is colour-mapped (black is low density and white is high density). This reveals much more features in the data, such as structure in the disk and artefacts related to the scanning nature of the Gaia satellite.
Current usage metrics show cumulative count of Article Views (full-text article views including HTML views, PDF and ePub downloads, according to the available data) and Abstracts Views on Vision4Press platform.
Data correspond to usage on the plateform after 2015. The current usage metrics is available 48-96 hours after online publication and is updated daily on week days.
Initial download of the metrics may take a while.