Fig. 9.
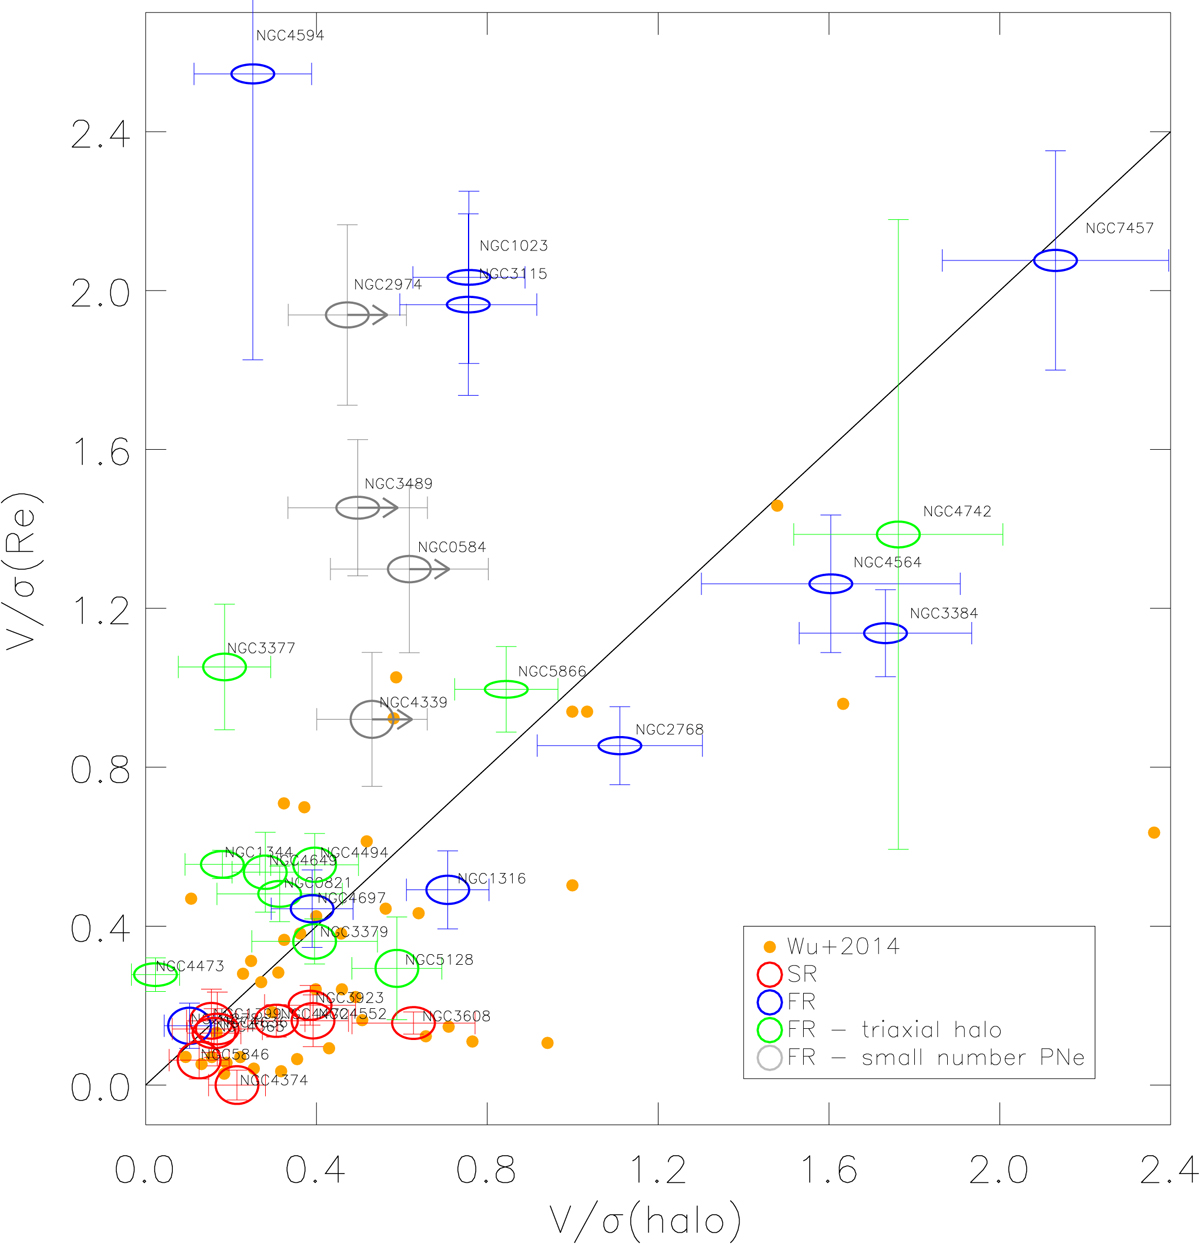
V/σ(Re) from absorption line data compared with V/σ(halo) from PN data. References for the absorption line data are in Table 1; for NGC 1399 and NGC 3923 data are available up to Re/2 and Re/4, respectively. The flattening of the ellipses used to plot the galaxies correspond to the ϵ values of Table 1. FRs and SRs are shown with different colors, as are the FR with triaxial halos. The gray open ellipses represent the galaxies (all FRs) with fewer tracers, for which our analysis provides a lower limit for V/σ(halo). The solid line traces equal values of V/σ(Re) and V/σ(halo). The orange circles shows the V/σ of simulated galaxies from Wu et al. (2014), divided by a factor 0.57 to rescale their two dimensional flux-weighted measurement to one-dimensional quantities (Cappellari et al. 2007). While the SRs show increased rotation in their halos, the majority of the FRs show a drop in rotation at large radii.
Current usage metrics show cumulative count of Article Views (full-text article views including HTML views, PDF and ePub downloads, according to the available data) and Abstracts Views on Vision4Press platform.
Data correspond to usage on the plateform after 2015. The current usage metrics is available 48-96 hours after online publication and is updated daily on week days.
Initial download of the metrics may take a while.