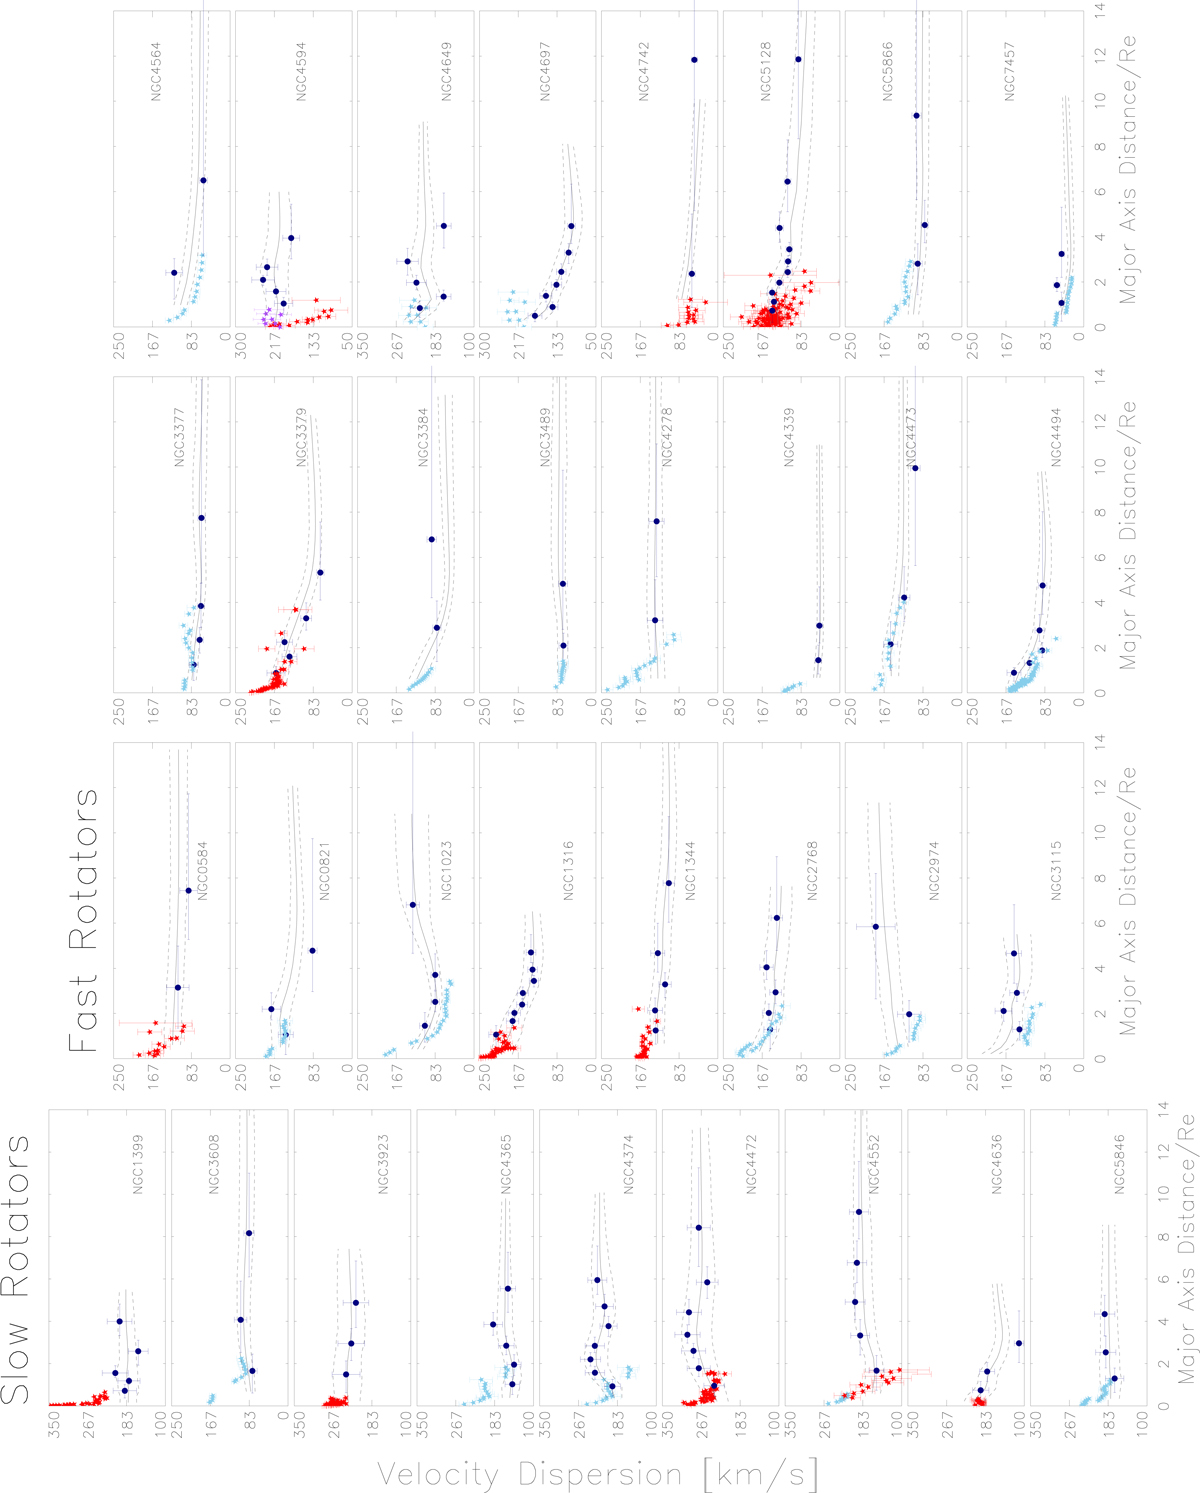
Fig. 7.

Azimuthally averaged velocity dispersion profiles as functions of the major axis distance in units of Re for SRs and FRs (full circles). The gray solid lines represent the profiles from the interpolated velocity fields with their errors (dashed lines, see text). The stars show dispersion from integrated light: when available we plot the kinemetric analysis of Foster et al. (2016) on the SLUGGS+ATLAS3D data in elliptical bins (light blue stars); for NGC 3384, NGC 3489, NGC 4339, NGC 4472, NGC 4552, and NGC 4636, we show azimuthally averaged profiles from ATLAS3D data (Cappellari et al. 2011; Emsellem et al. 2011); for the other galaxies we show data from long slit spectroscopy along PAphot (red stars, references in Table 1). For NGC 4594 we also plot the stellar velocity dispersion profile in a slit parallel to the major axis but 30 arcsec offset from the center (purple stars).
Current usage metrics show cumulative count of Article Views (full-text article views including HTML views, PDF and ePub downloads, according to the available data) and Abstracts Views on Vision4Press platform.
Data correspond to usage on the plateform after 2015. The current usage metrics is available 48-96 hours after online publication and is updated daily on week days.
Initial download of the metrics may take a while.


