Fig. 10.
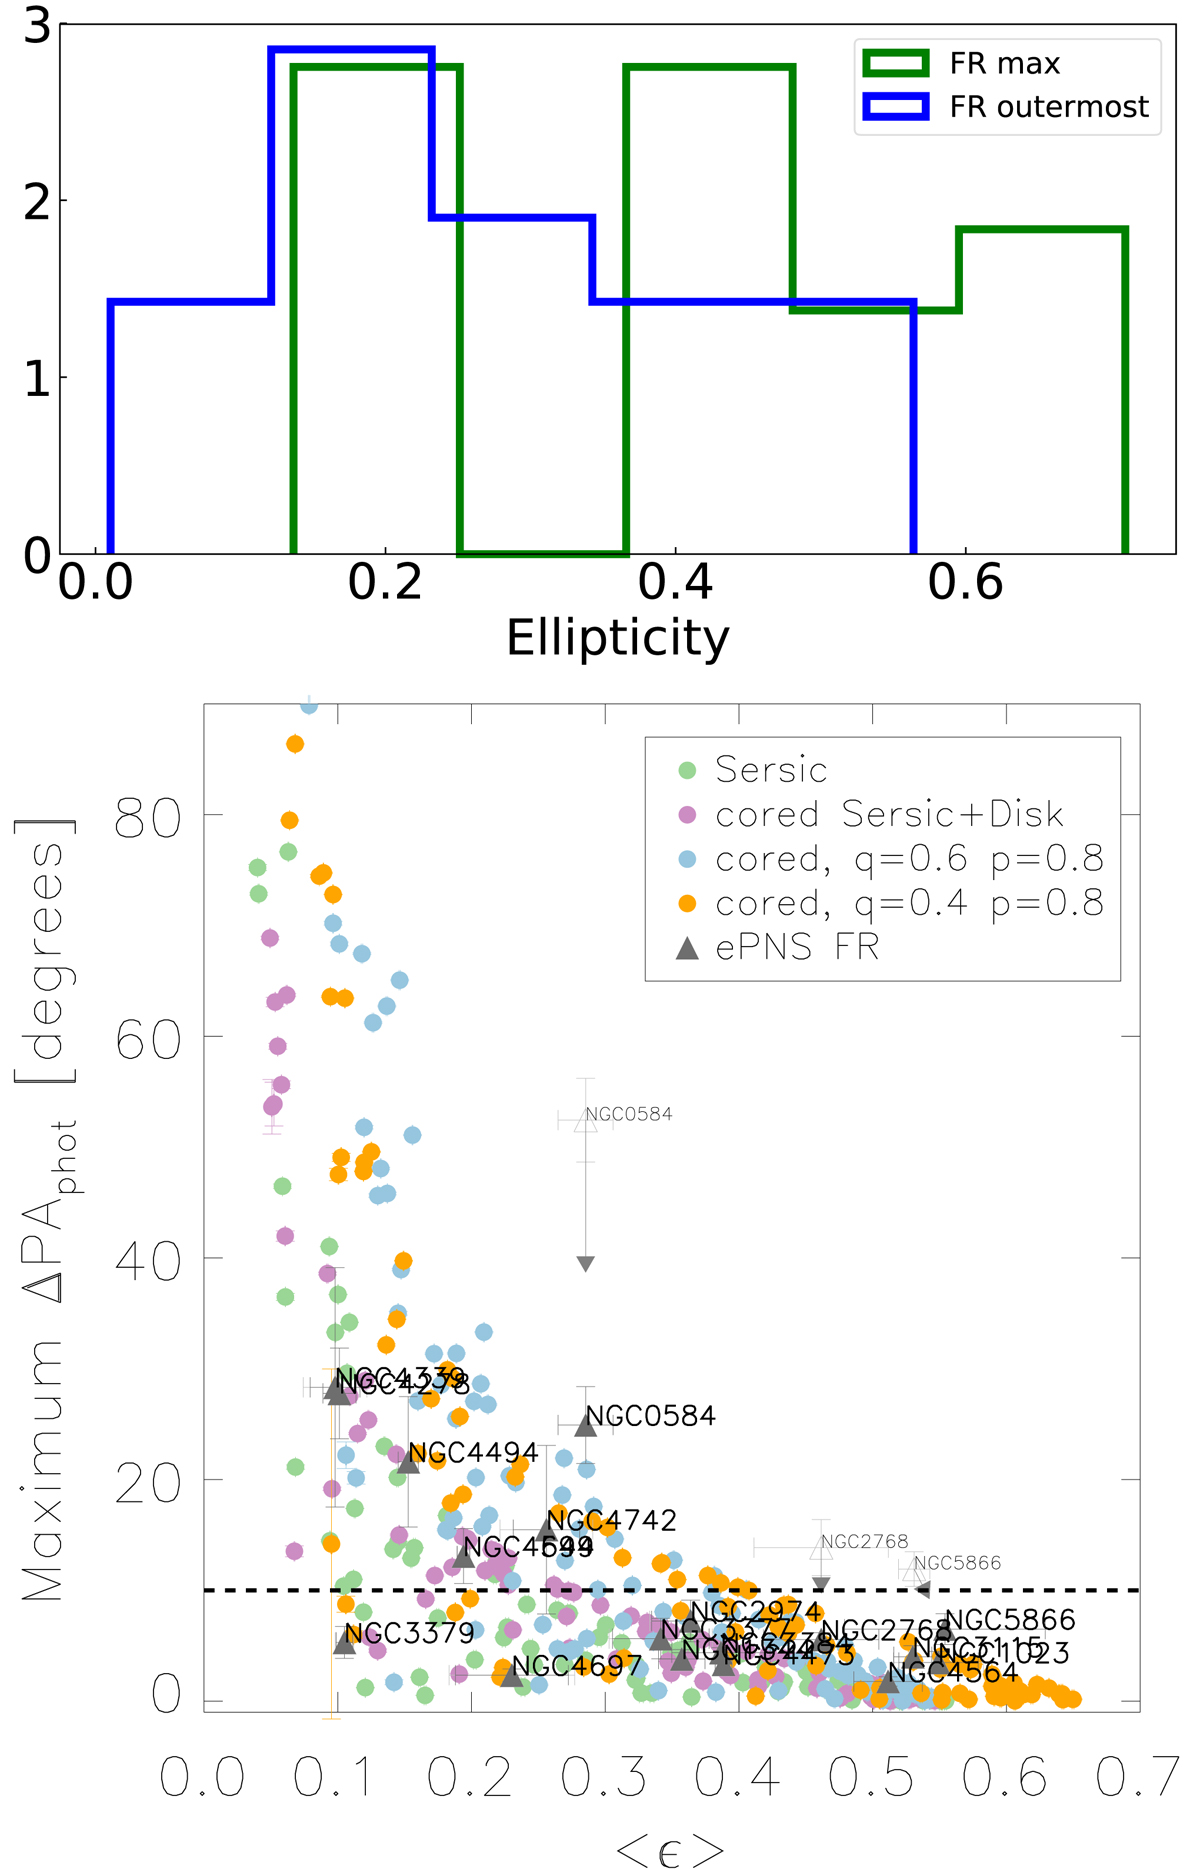
Upper panel: ellipticity distribution for the FRs. The histogram of the maximum measured ellipticity at R > 0.5 Re is in green; the histogram of the outermost measured values is in blue. The distributions show that the FRs tend to have halos rounder than their central regions. Lower panel: maximum photometric twist versus mean projected ellipticity for a subsample of the ePN.S FRs with extended photometric data (gray triangles; see text and Appendix B.1, references in Table 2). The errors reflect the scatter between contiguous data points in the photometric profiles. For the galaxies with indications for ongoing interactions in the outermost photometry (see Appendices B.1 and C) we estimated the mean ellipticity and maximum position angle twist both from the complete profiles (open symbols) and considering only the regions with regular photometry (filled symbols). For NGC 1023 and NGC 3384 we show quantities derived excluding the regions where the bar dominates. The horizontal dashed line marks ΔPAphot = 10 degrees. The statistical distribution of points is consistent with simple photometric triaxial models, shown each with 100 random projections (solid circles as described in the legend; see text and Appendix B.2).
Current usage metrics show cumulative count of Article Views (full-text article views including HTML views, PDF and ePub downloads, according to the available data) and Abstracts Views on Vision4Press platform.
Data correspond to usage on the plateform after 2015. The current usage metrics is available 48-96 hours after online publication and is updated daily on week days.
Initial download of the metrics may take a while.