Fig. 1.
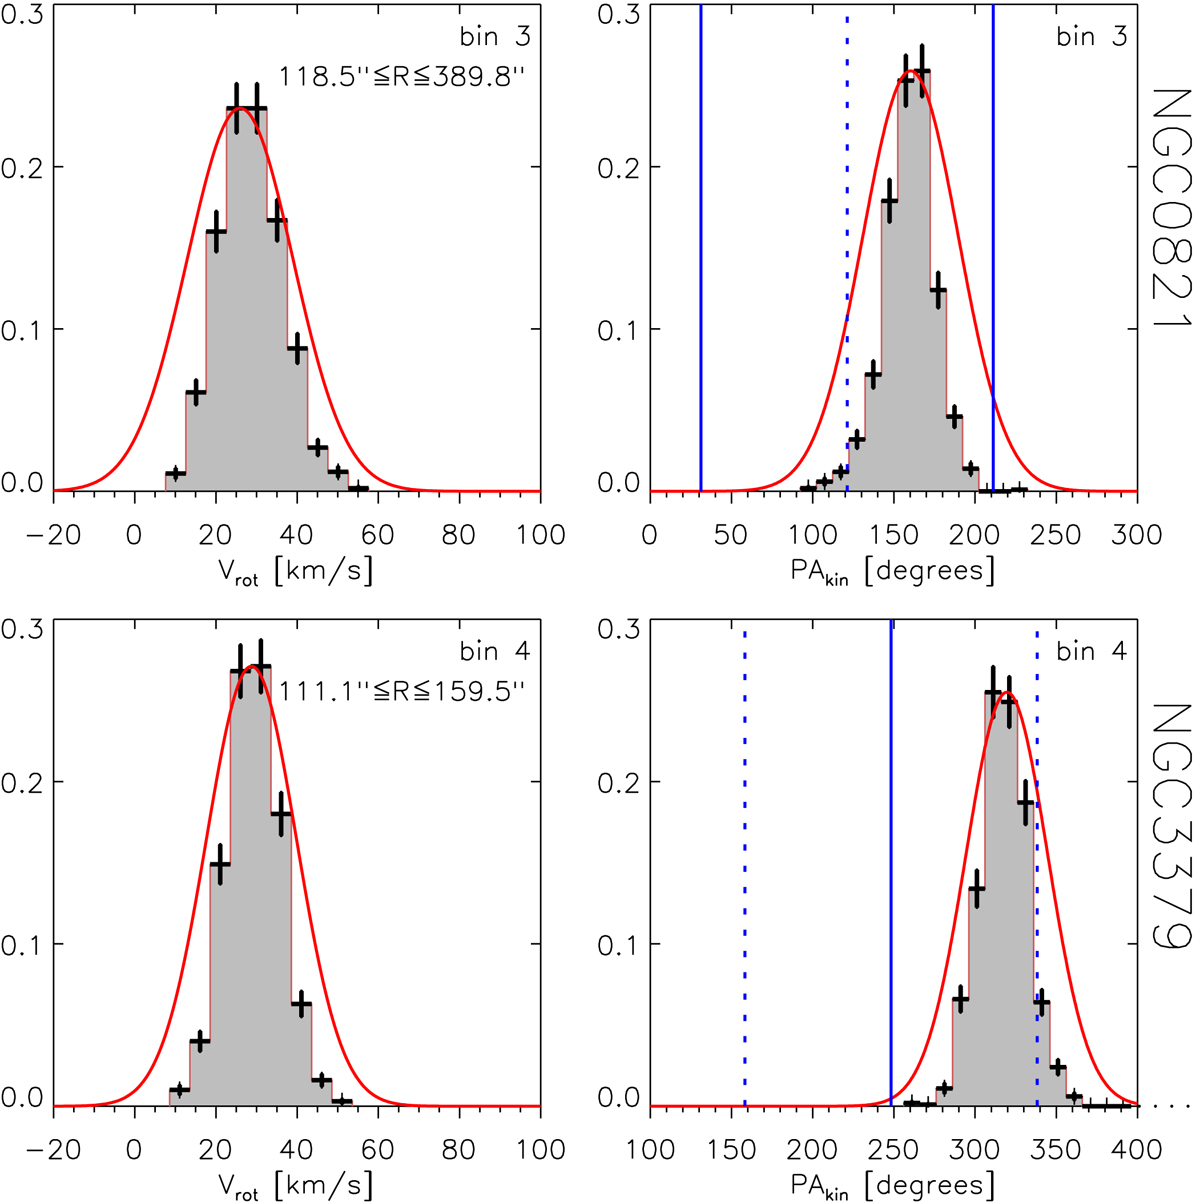
Distribution of the fitted Vrot and PAkin in one radial bin obtained from 1000 PN subsamples extracted for NGC 0821 and NGC 3379 (gray histograms). The red curves are Gaussians centered on the Vrot and PAkin fitted on the full dataset, and with dispersion given by the Monte Carlo simulations of the galaxy under study. The vertical solid lines show the position angle of the photometric major axis for the two galaxies; the dotted lines show the photometric minor axis. The values for PAphot are listed in Table 1.
Current usage metrics show cumulative count of Article Views (full-text article views including HTML views, PDF and ePub downloads, according to the available data) and Abstracts Views on Vision4Press platform.
Data correspond to usage on the plateform after 2015. The current usage metrics is available 48-96 hours after online publication and is updated daily on week days.
Initial download of the metrics may take a while.