Free Access
Fig. 6.
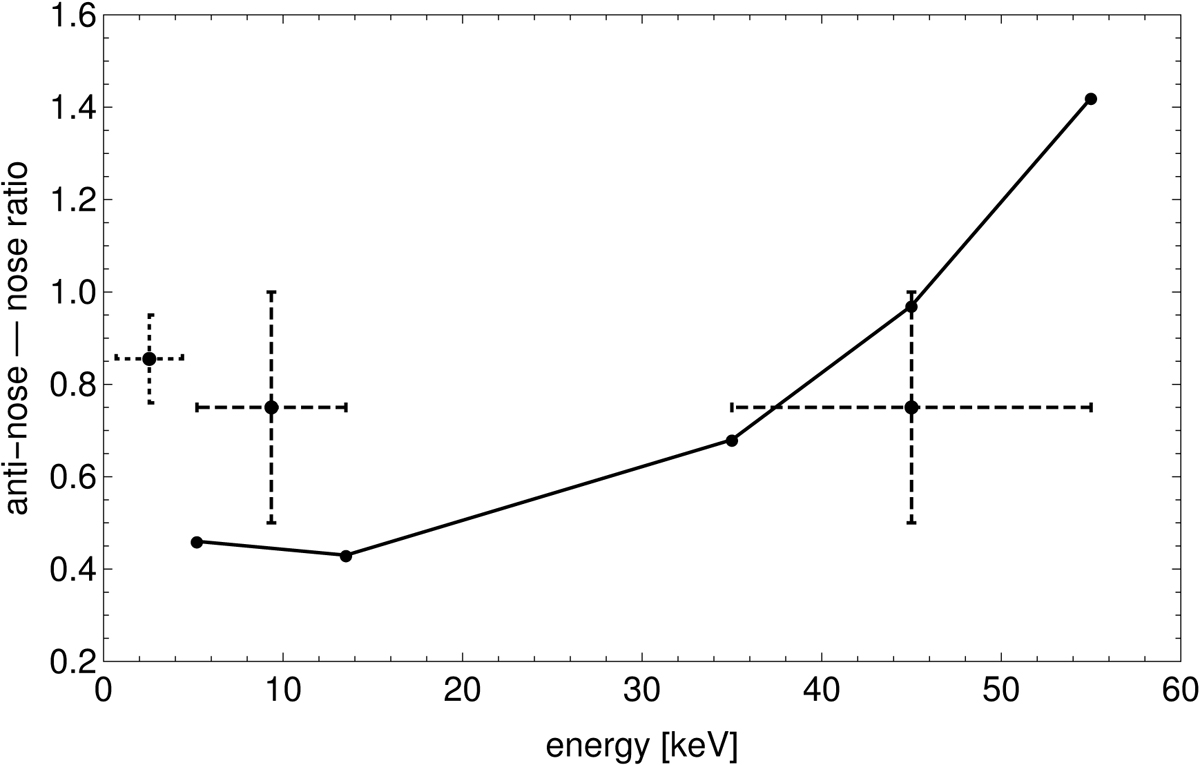
Tail/apex ENA flux ratio. Crosses show our estimations using the data of IBEX Hi (0.7−4.4 keV, Schwadron et al. 2014) averaged over the period 2009−2013, and INCA (5.2−13.5 and 35−55 keV, Dialynas et al. 2017, Fig. 3a, average over the period 2003−2009). The continuous line indicates the toy model prediction.
Current usage metrics show cumulative count of Article Views (full-text article views including HTML views, PDF and ePub downloads, according to the available data) and Abstracts Views on Vision4Press platform.
Data correspond to usage on the plateform after 2015. The current usage metrics is available 48-96 hours after online publication and is updated daily on week days.
Initial download of the metrics may take a while.