Fig. 2.
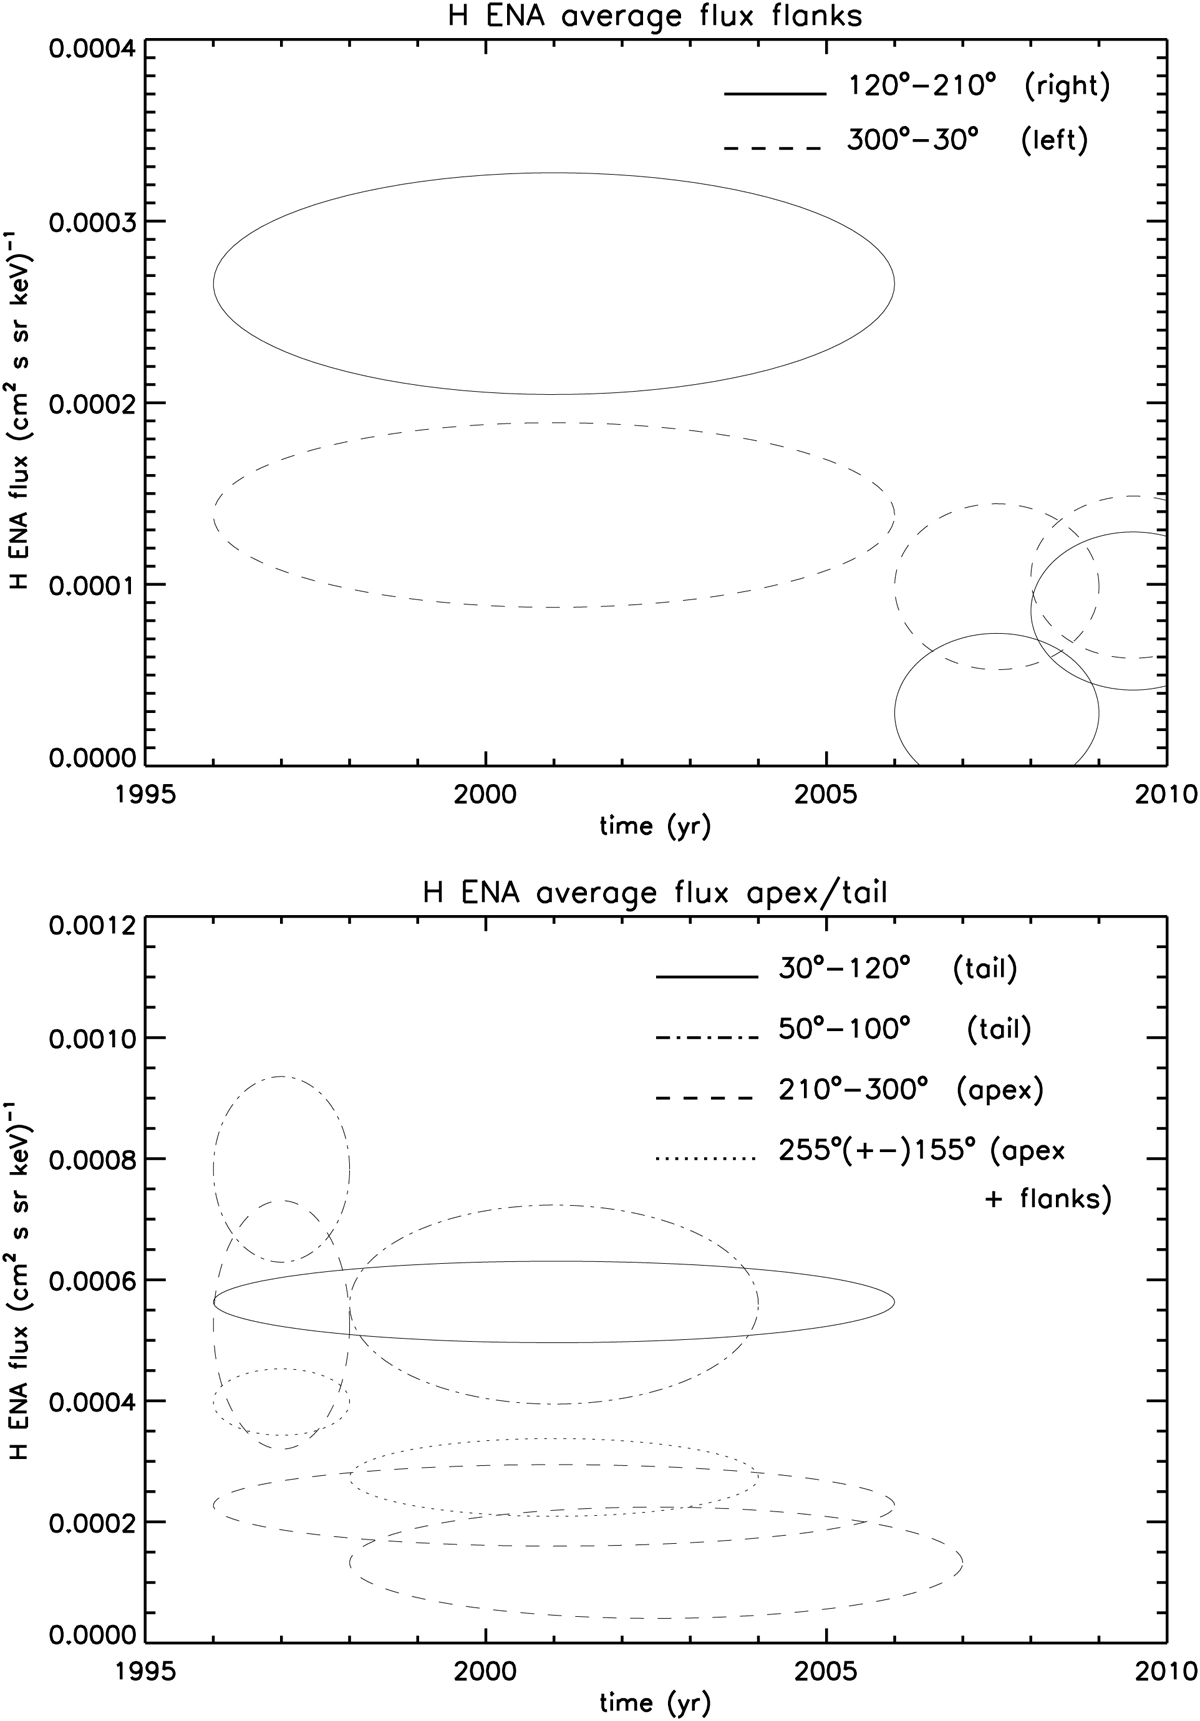
Energy-averaged hydrogen ENA flux measurements by HSTOF. The upper panel shows the ENA flux from the flank directions (120° − 210° and 300° − 30° ecliptic longitude sectors). The lower panel shows the flux from the forward sector (210° − 300°), the forward + flanks sector (255° ± 155°), and the heliotail sector (30° − 120° or 50° − 100°). The data are shown as ellipses; the vertical semiaxes represent statistical 1σ deviations and the horizontal axes indicate time intervals.
Current usage metrics show cumulative count of Article Views (full-text article views including HTML views, PDF and ePub downloads, according to the available data) and Abstracts Views on Vision4Press platform.
Data correspond to usage on the plateform after 2015. The current usage metrics is available 48-96 hours after online publication and is updated daily on week days.
Initial download of the metrics may take a while.