Fig. 9.
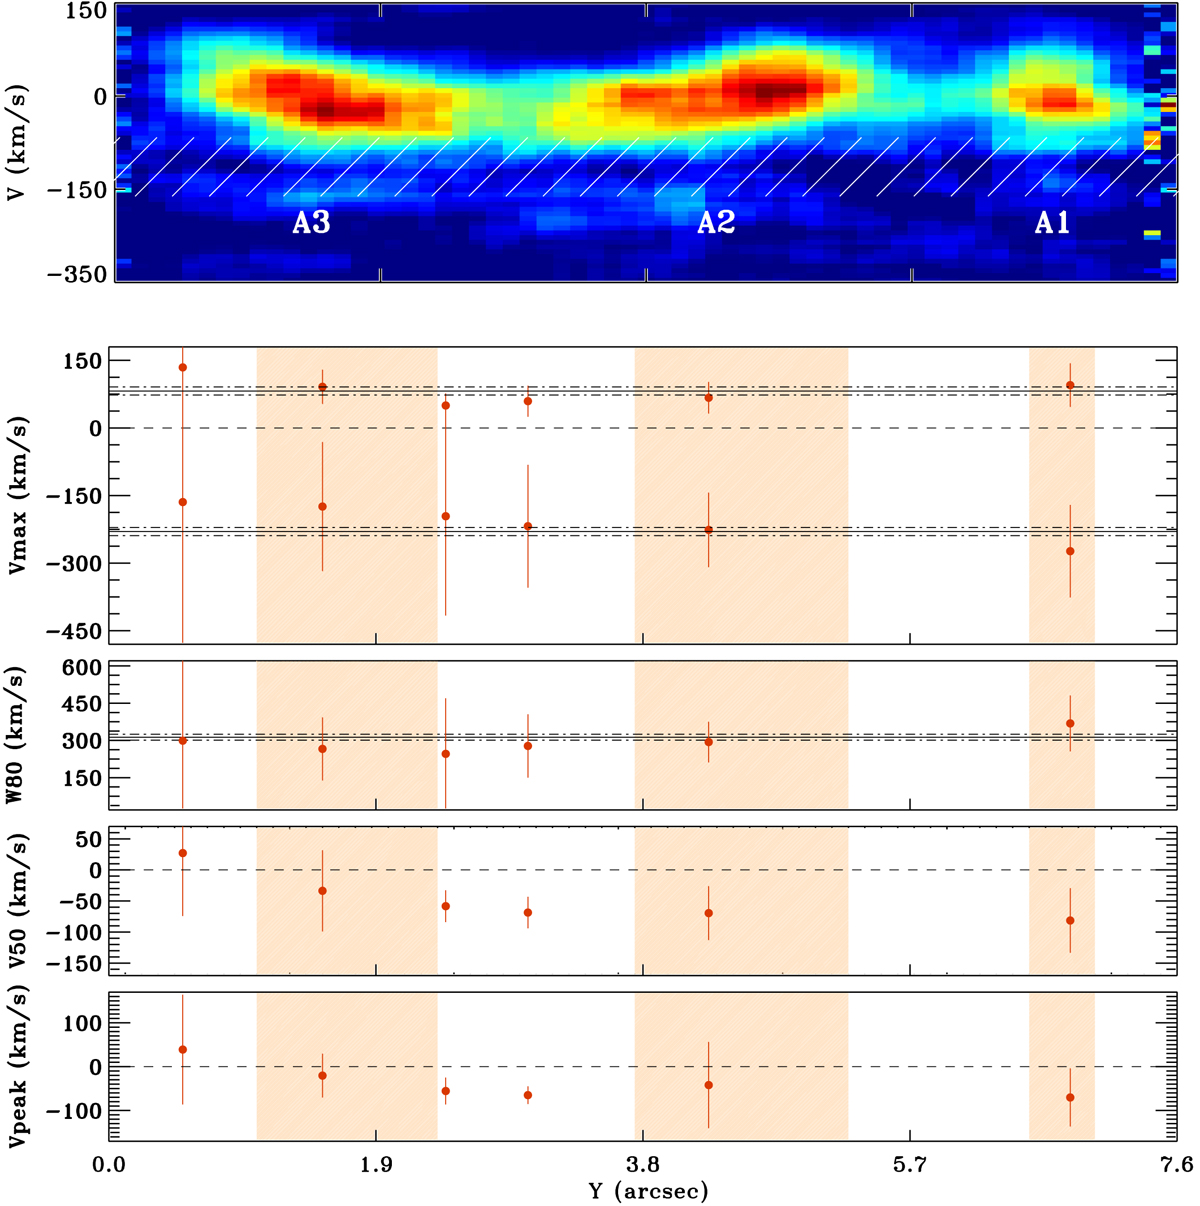
Top panel: zoom of the J0022 2D spectrum around the Hα line; the shaded white area shows the region associated with bad skyline subtraction residuals. Lower panels: J0022 non-parametric velocity measurements as a function of the position along the spatial axis from which 1D spectra have been extracted. Red symbols refer to [N II] line velocity measurements. In the first panel, V90 (positive) and V10 (negative) measurements are reported. The other panels show W80, V50, and Vpeak variations. See Fig. 6 for a more detailed description of the figure.
Current usage metrics show cumulative count of Article Views (full-text article views including HTML views, PDF and ePub downloads, according to the available data) and Abstracts Views on Vision4Press platform.
Data correspond to usage on the plateform after 2015. The current usage metrics is available 48-96 hours after online publication and is updated daily on week days.
Initial download of the metrics may take a while.