Free Access
Fig. 7.
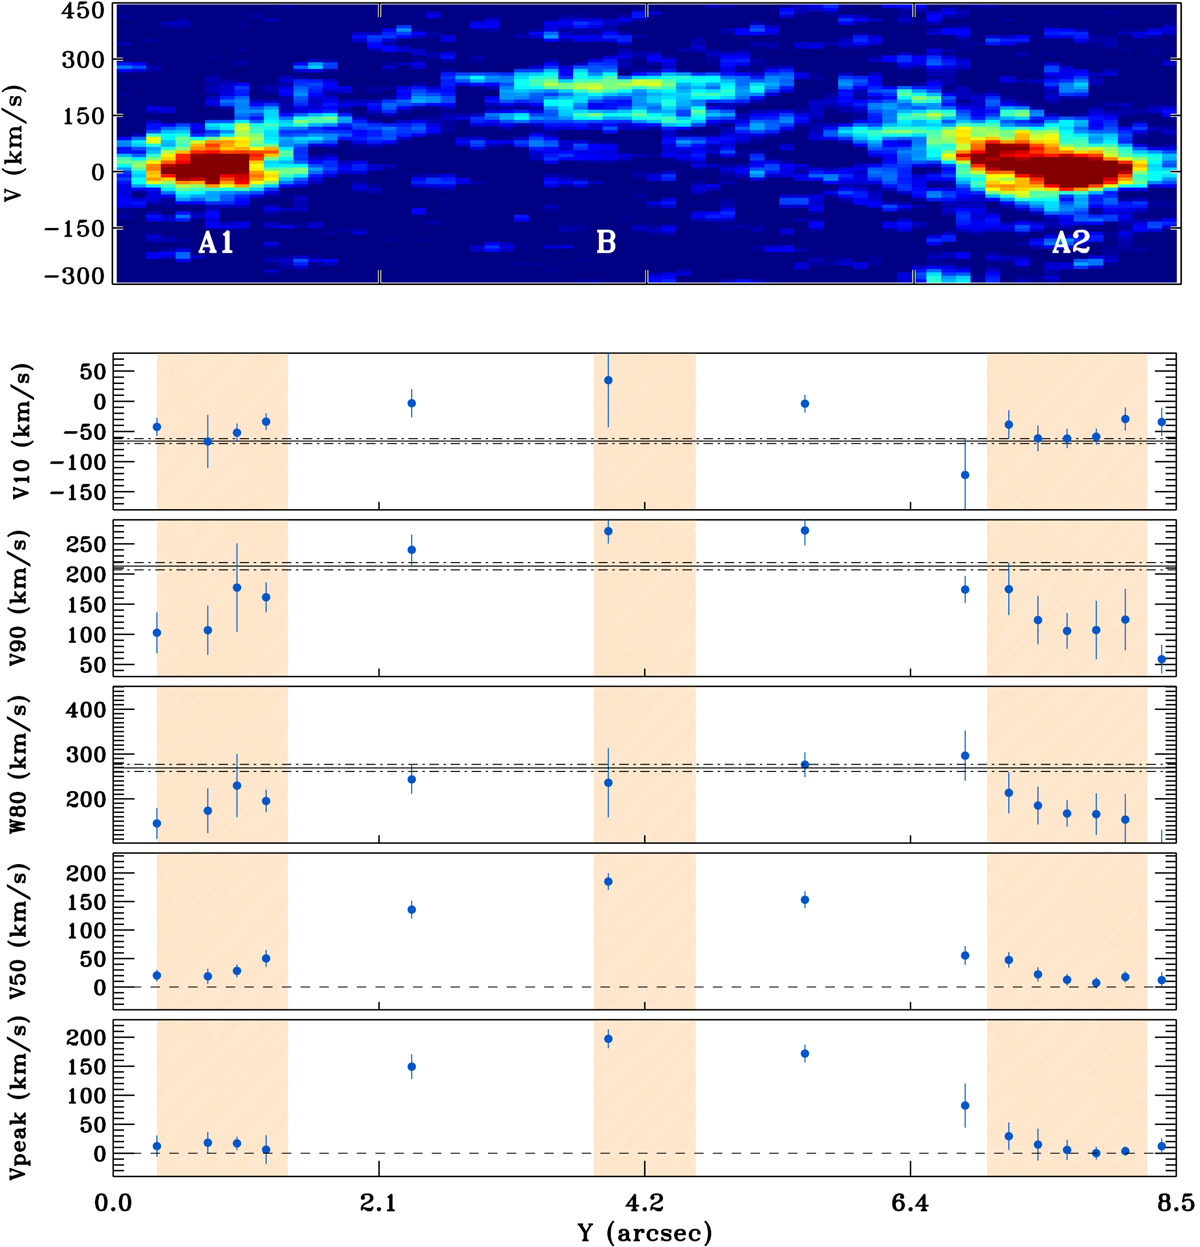
Top panel: zoom of the J1958 2D spectrum around the [O III] line. Lower panels: J1958 non-parametric velocity measurements as a function of the position along the dispersion axis from which 1D spectra have been extracted. Blue symbols refer to [O III] measurements. See Fig. 6 for a more detailed description of the figure.
Current usage metrics show cumulative count of Article Views (full-text article views including HTML views, PDF and ePub downloads, according to the available data) and Abstracts Views on Vision4Press platform.
Data correspond to usage on the plateform after 2015. The current usage metrics is available 48-96 hours after online publication and is updated daily on week days.
Initial download of the metrics may take a while.