Fig. 5.
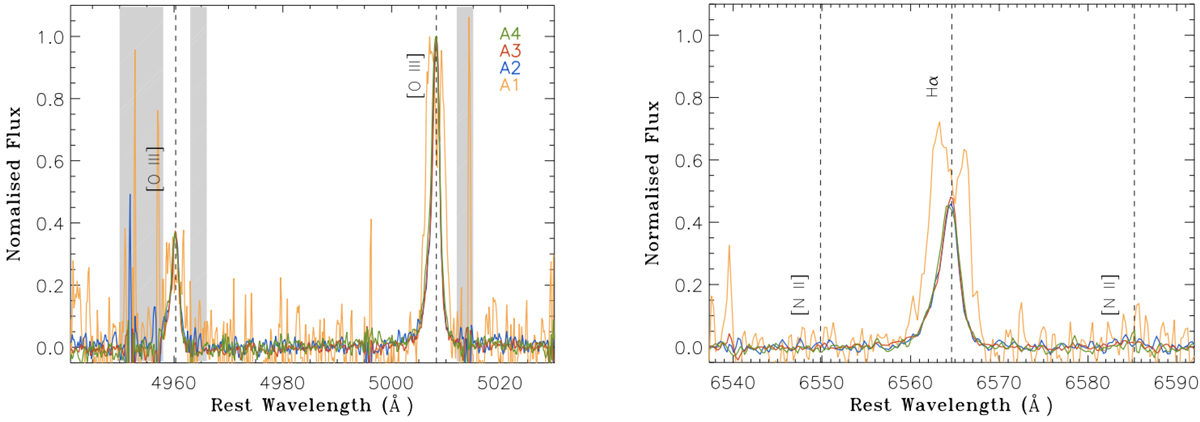
J1038 integrated spectra of the four bright knots, colour-coded as labelled in the left panel. Grey shaded regions mark the wavelength ranges most affected by sky-line residuals and excluded from the spectral fit. To facilitate the comparison, we normalised the fluxes so that the peak intensity of the [O III] line is unity for each integrated spectrum.
Current usage metrics show cumulative count of Article Views (full-text article views including HTML views, PDF and ePub downloads, according to the available data) and Abstracts Views on Vision4Press platform.
Data correspond to usage on the plateform after 2015. The current usage metrics is available 48-96 hours after online publication and is updated daily on week days.
Initial download of the metrics may take a while.