Fig. 3.
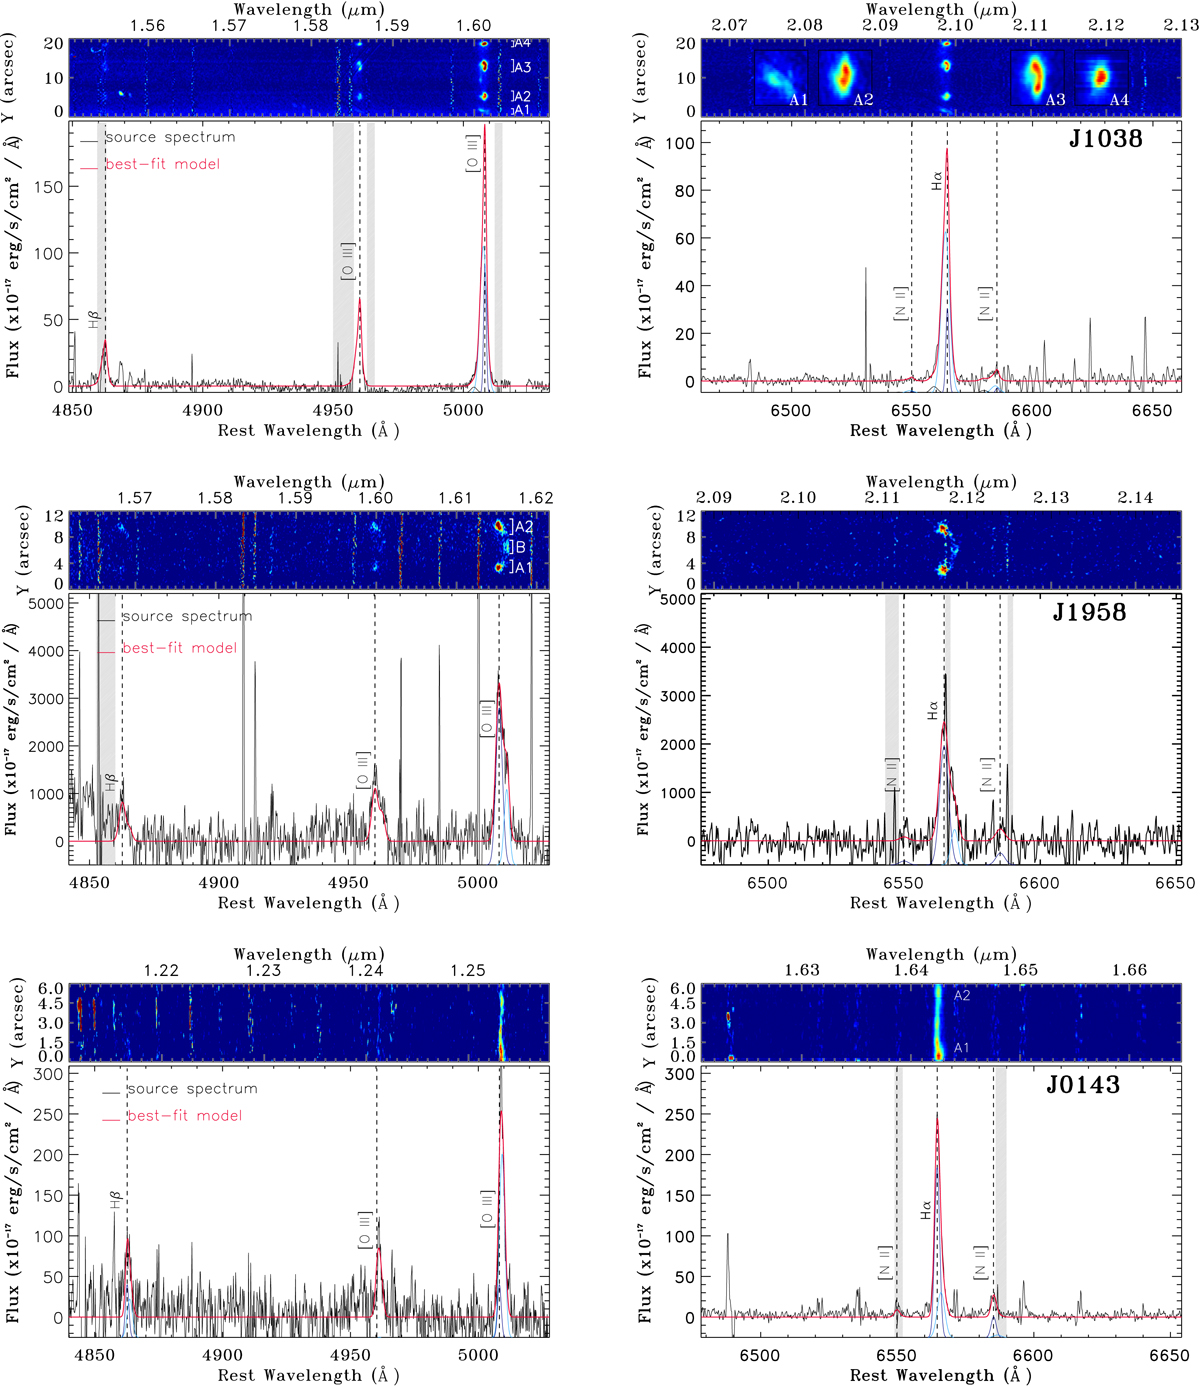
Portion of LBT/ARGOS NIR integrated spectra of J1038 (top panels), J1958 (central panels) and J0143 (bottom panels). Superimposed on the spectra are the best-fitting components presented in Sect. 4, with arbitrary normalisation for visualisation purposes; the red solid curve shows the sum of all best-fit components. The dotted lines mark the wavelengths of Hβ,[O III]λλ4959,5007 (left) and [N II]λ6548, Hα and [N II]λ6584 (right), from left to right, respectively. The regions excluded from the fit of the Gaussian components and corresponding to the most intense sky lines are highlighted as shaded areas. For each spectrum and each region, the upper panel shows the observer-frame 2D spectrum (blue to red colours represent increasing fluxes). The closing square bracket labels in the 2D spectra locate the regions (spaxels) from which we obtained the 1D integrated spectra associated with the different knots. For J1038, we also show zoomed portions of the 2D spectrum associated with the four different Hα knots. The features at ∼1.558 μm in the 2D spectrum of J1038 are associated with the LUCI detectors’ persistences.
Current usage metrics show cumulative count of Article Views (full-text article views including HTML views, PDF and ePub downloads, according to the available data) and Abstracts Views on Vision4Press platform.
Data correspond to usage on the plateform after 2015. The current usage metrics is available 48-96 hours after online publication and is updated daily on week days.
Initial download of the metrics may take a while.