Fig. 2.
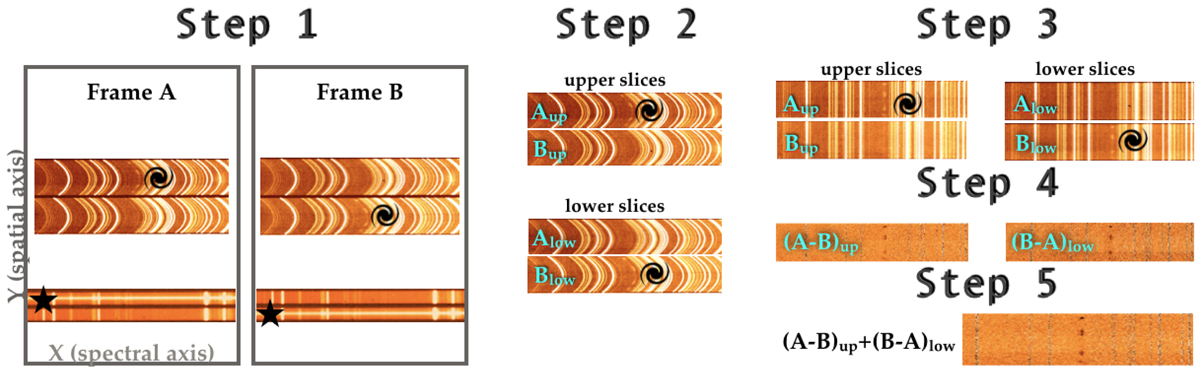
Sketch to illustrate some of the steps of the data reduction (see Sect. 3 for the complete data-reduction procedure used in this work). For clarity, the diagram shows a set of only two subsequent frames. The first two panels show a sketch of a 150s exposure through a MOS mask designed to observe a science target and a reference star with two dither positions. The panels display the 2D spectra obtained from the two curved slitlets (in the upper side), dedicated to the science target, and two long slits (in the lower part), to allocate the reference star spectrum. The extended structures observed in the upper spectra, due to sky emission lines, highlight the strong distortion caused by the curved slitlets. In the first panel (frame A), the target and the reference star are in the relative upper positions: J1038+4849 Hα emission line blobs can be distinguished in the figure (in the vicinity of the spiral symbol), as well as the stellar continuum (next to the star symbol). In the second panel (frame B), the objects are in the relative lower positions. The insets in the Step 2 show the extracted slices from the upper and lower positions, distinguishing between A and B spectra. These 2D spectra are then displayed in the Step 3 part of the diagram, after the rectification. Step 4 shows the A–B and B–A results for both upper and lower slices (the colour bars here are inverted for a better visual inspection of the Hα knots). Finally, Step 5 shows the final 2D spectrum obtained from the combination of the Step 4 intermediate products.
Current usage metrics show cumulative count of Article Views (full-text article views including HTML views, PDF and ePub downloads, according to the available data) and Abstracts Views on Vision4Press platform.
Data correspond to usage on the plateform after 2015. The current usage metrics is available 48-96 hours after online publication and is updated daily on week days.
Initial download of the metrics may take a while.