Fig. 11.
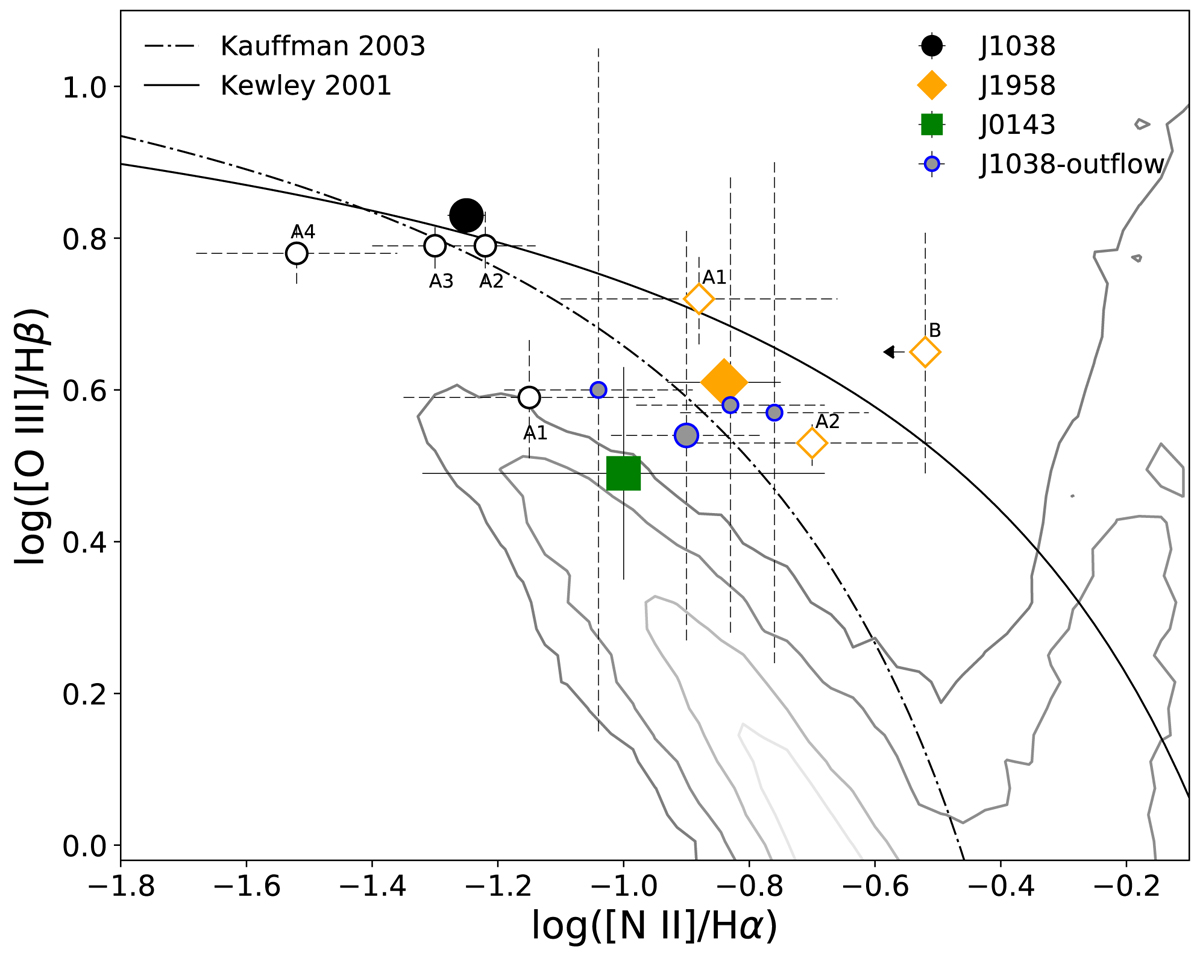
Standard diagnostic BPT diagram showing the classification scheme by Kewley et al. (2001) for our flux ratio measurements, in comparison with the SDSS (z ∼ 0) sample (Abazajian et al. 2009; grey contours). The lines drawn in the figure display the curves used to separate H II-like ionised regions from galaxies containing AGN (from Kewley et al. 2001 and Kauffman et al. 2003, as labelled). Black dots refer to J1038 flux ratios, orange diamonds refer to J1958 measurements, and the purple point represents J0143 line ratios. For J1038 and J1958, we report the ratios derived for each knot associated with the arc structure (A1, A2, A3 and A4 for J1038; A1, A2 and B for J1958). For J1038, for which we have evidence for the presence of warm outflows, we report the flux ratios associated with the high-velocity gas emission for the A2, A3, and A4 images (blue/black small dots) and for the total integrated spectrum (blue/black dots; see text for details).
Current usage metrics show cumulative count of Article Views (full-text article views including HTML views, PDF and ePub downloads, according to the available data) and Abstracts Views on Vision4Press platform.
Data correspond to usage on the plateform after 2015. The current usage metrics is available 48-96 hours after online publication and is updated daily on week days.
Initial download of the metrics may take a while.