Fig. 7.
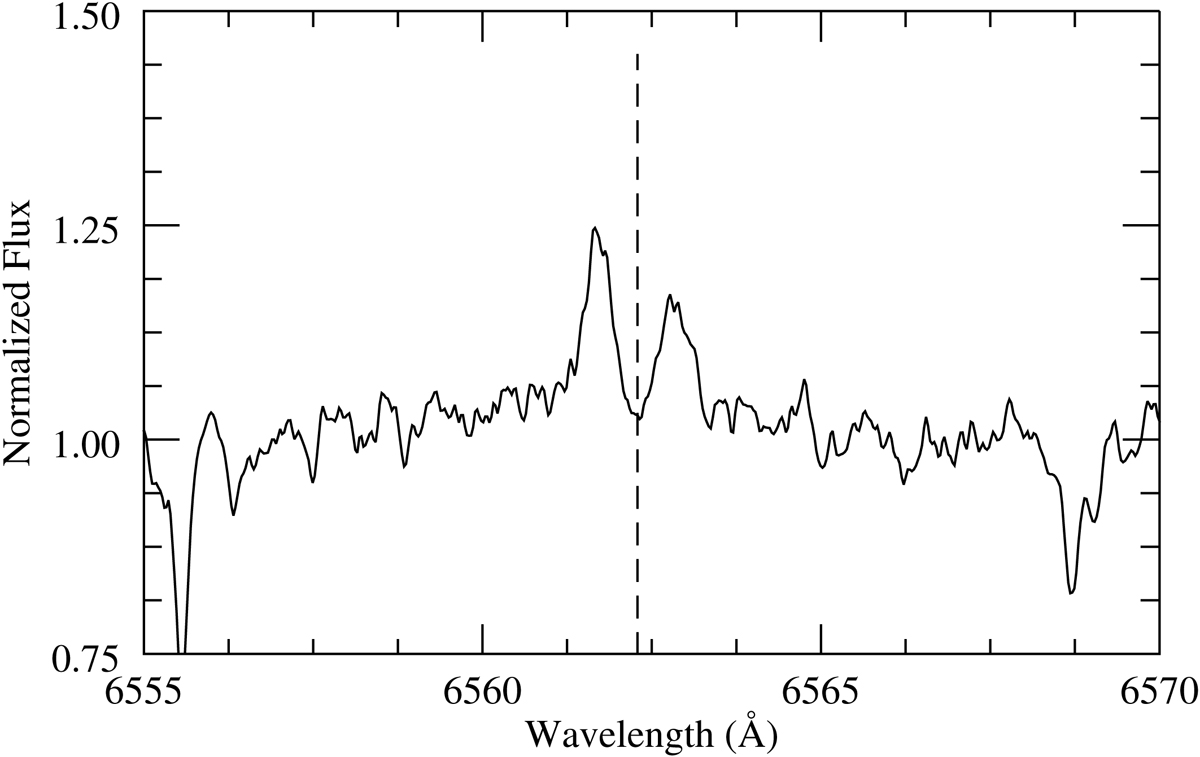
J201633 FEROS spectra covering Hα emission wavelengths. The dashed line highlights the predicted position of the Hα emission line given the measured RV of the M0.0 primary. No emission is visible at this position. However, emission lines are observed shifted to the blue and red of this position. This suggests the M0.0 primary is no longer active because the system is old whilst the M2.0 secondary is an unresolved synchronized pair which is active due to tidal spin-up, resulting in Hα emission shifted according to the RV of the individual components.
Current usage metrics show cumulative count of Article Views (full-text article views including HTML views, PDF and ePub downloads, according to the available data) and Abstracts Views on Vision4Press platform.
Data correspond to usage on the plateform after 2015. The current usage metrics is available 48-96 hours after online publication and is updated daily on week days.
Initial download of the metrics may take a while.