Fig. 6.
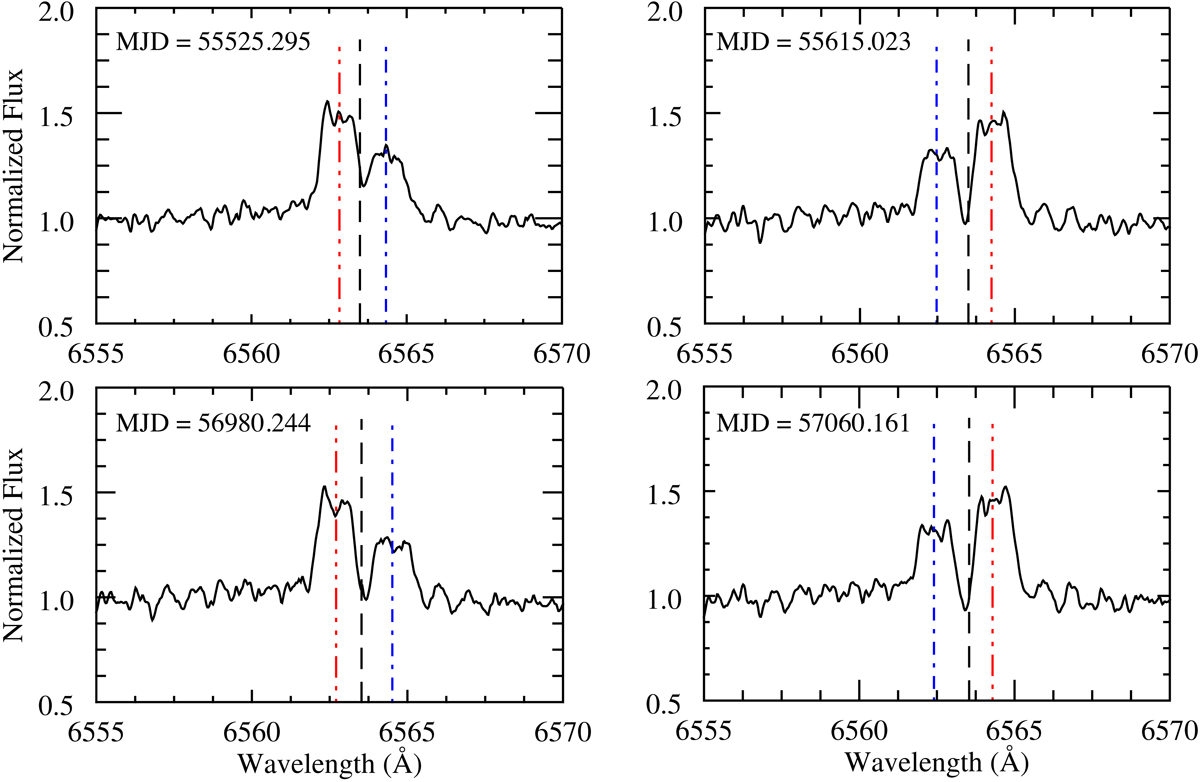
Four epochs of J053018 FEROS spectra covering Hα emission wavelengths. The dashed lines highlight the predicted positions of the Hα emission line given the measured RVs of the A (black line), B (red line) and C (blue line) components. In each epoch, prominent emission lines are visible at the predicted Hα position given the measured RVs of the BC pair, whilst no emission is visible at the predicted Hα position given the measured RV of the A component.
Current usage metrics show cumulative count of Article Views (full-text article views including HTML views, PDF and ePub downloads, according to the available data) and Abstracts Views on Vision4Press platform.
Data correspond to usage on the plateform after 2015. The current usage metrics is available 48-96 hours after online publication and is updated daily on week days.
Initial download of the metrics may take a while.