Fig. 2.
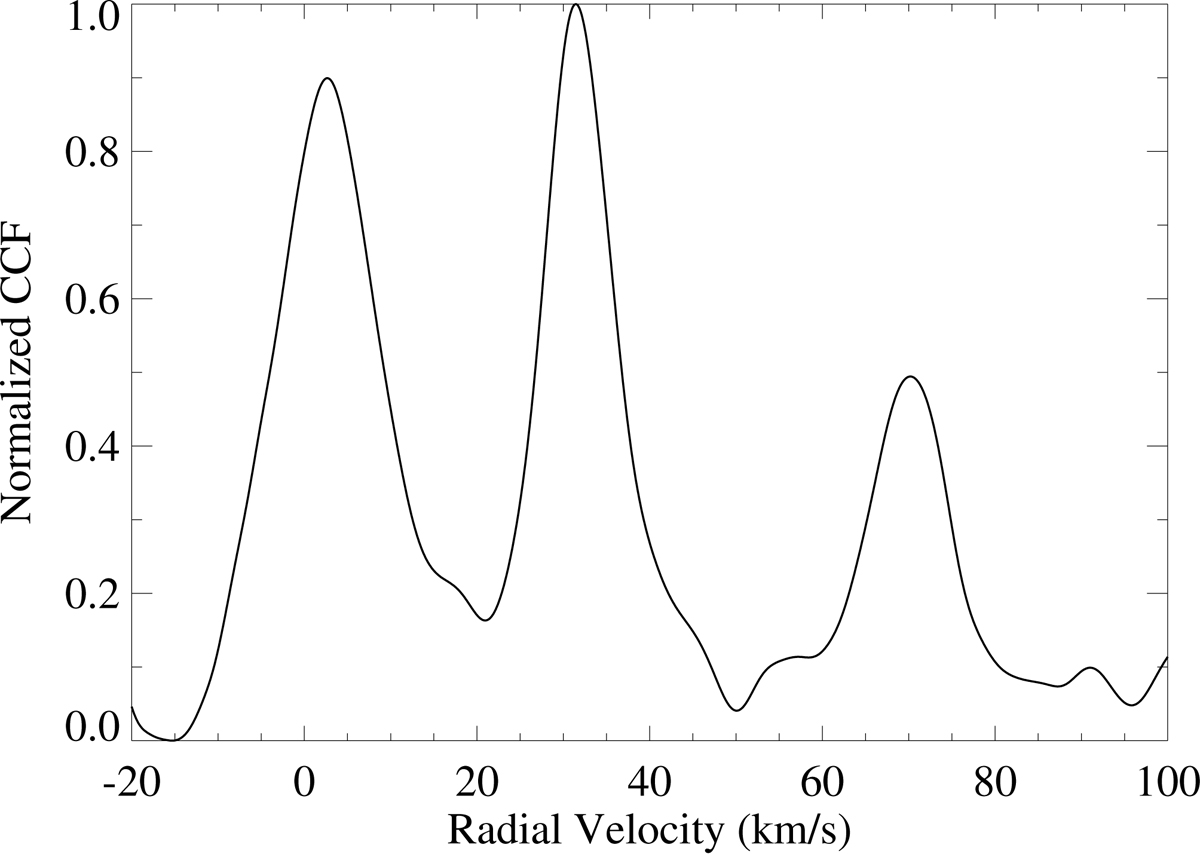
Example CCF plot for the J053018 system. Three individual peaks are clearly distinguishable, and therefore we identify the system as a three-component spectroscopic multiple. Spectroscopic components are identified by tracing CCF peak strength across each epoch. We relate the strongest peak to the A component, occurring at ∼30 km s−1, the 2nd strongest peak to the B component, occurring at ∼0 km s−1, and the lowest strength peak to C component, occurring at ∼70 km s− 1. The CCF displayed has been measured for MJD = 55525.295, across the 36th spectral order.
Current usage metrics show cumulative count of Article Views (full-text article views including HTML views, PDF and ePub downloads, according to the available data) and Abstracts Views on Vision4Press platform.
Data correspond to usage on the plateform after 2015. The current usage metrics is available 48-96 hours after online publication and is updated daily on week days.
Initial download of the metrics may take a while.