Fig. 8
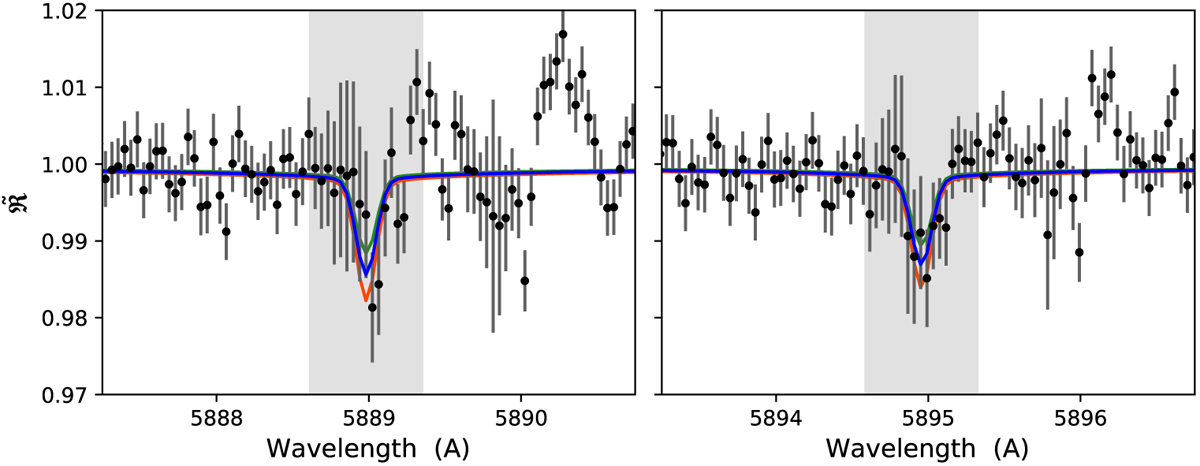
High-resolution spectrum (black points with 1σ error bars) and best-fitting model (solid blue line) around the sodium doublet lines for the retrieval at solar Na abundance. The shaded area denotes the wavelength region used toconstrain the models. The green and red lines denote the model spectrum if R0 were 5% smaller or larger, respectively.
Current usage metrics show cumulative count of Article Views (full-text article views including HTML views, PDF and ePub downloads, according to the available data) and Abstracts Views on Vision4Press platform.
Data correspond to usage on the plateform after 2015. The current usage metrics is available 48-96 hours after online publication and is updated daily on week days.
Initial download of the metrics may take a while.