Free Access
Fig. 6
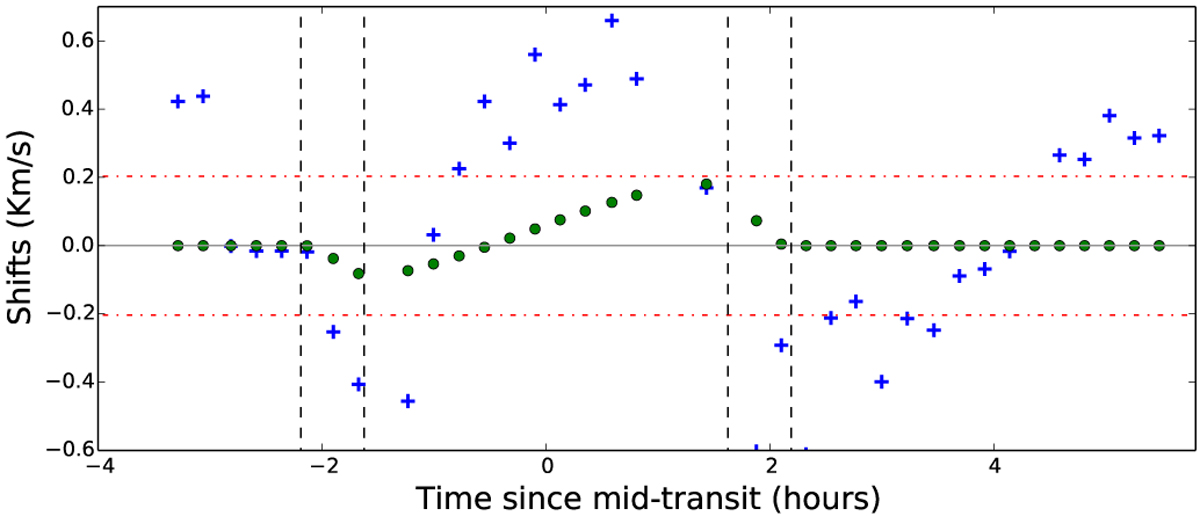
RM model vs. spectral misalignments of sodium region. Blue crosses show the misalignment in the sodium lines region (already shown in Fig. 1). Green field circles show the calculated RM effect. Red dash-dotted line shows the alignment precision of the data (± 0.004 Å). The RM effect is below the precision of the alignment.
Current usage metrics show cumulative count of Article Views (full-text article views including HTML views, PDF and ePub downloads, according to the available data) and Abstracts Views on Vision4Press platform.
Data correspond to usage on the plateform after 2015. The current usage metrics is available 48-96 hours after online publication and is updated daily on week days.
Initial download of the metrics may take a while.