Fig. 5
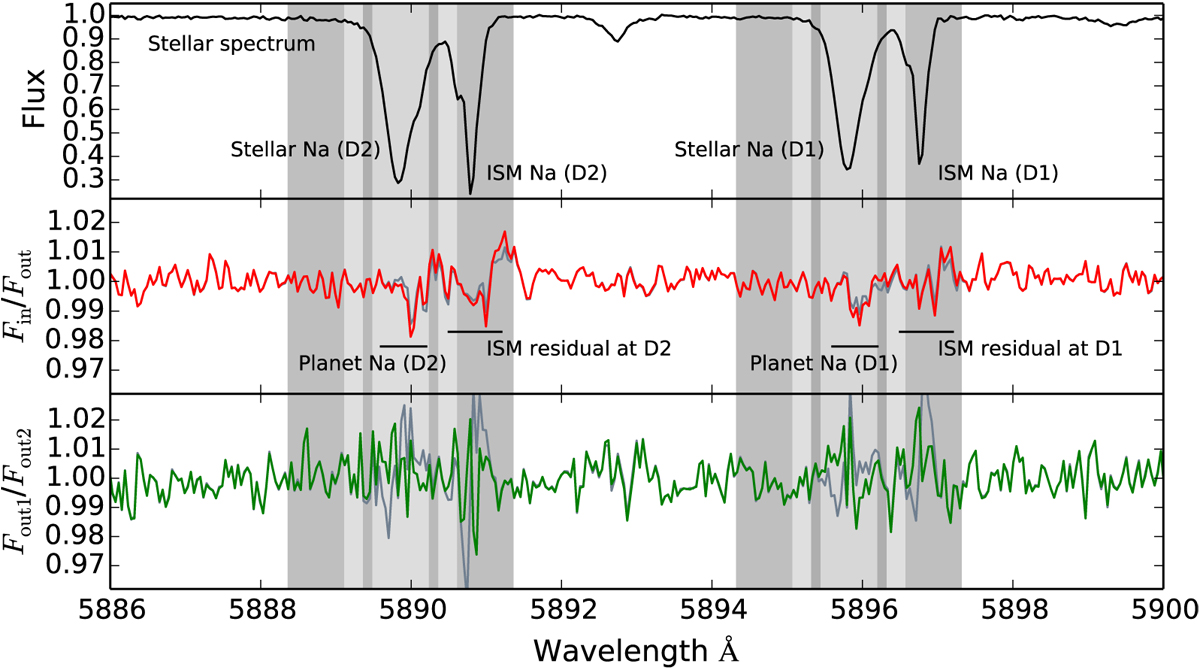
Transmission spectrum obtained using the division approach. The black profile in the first panel is the stellar spectrum. The red profile in the second panel is the division of the in-transit by the out-of-transit spectra, corrected for the exoplanetary RV shifts. The dark gray profile beneath the red profile is the division after applying the trial manual shifts. The dark gray profile in the third panel is the division of two sets of out-of-transit spectra. The green profile is the same division shifted with respect to the other by 0.004 Å. Finally, the shaded regions represent the integration bands at 0.75, 1, 1.5, and 3 Å.
Current usage metrics show cumulative count of Article Views (full-text article views including HTML views, PDF and ePub downloads, according to the available data) and Abstracts Views on Vision4Press platform.
Data correspond to usage on the plateform after 2015. The current usage metrics is available 48-96 hours after online publication and is updated daily on week days.
Initial download of the metrics may take a while.