Free Access
Fig. 2
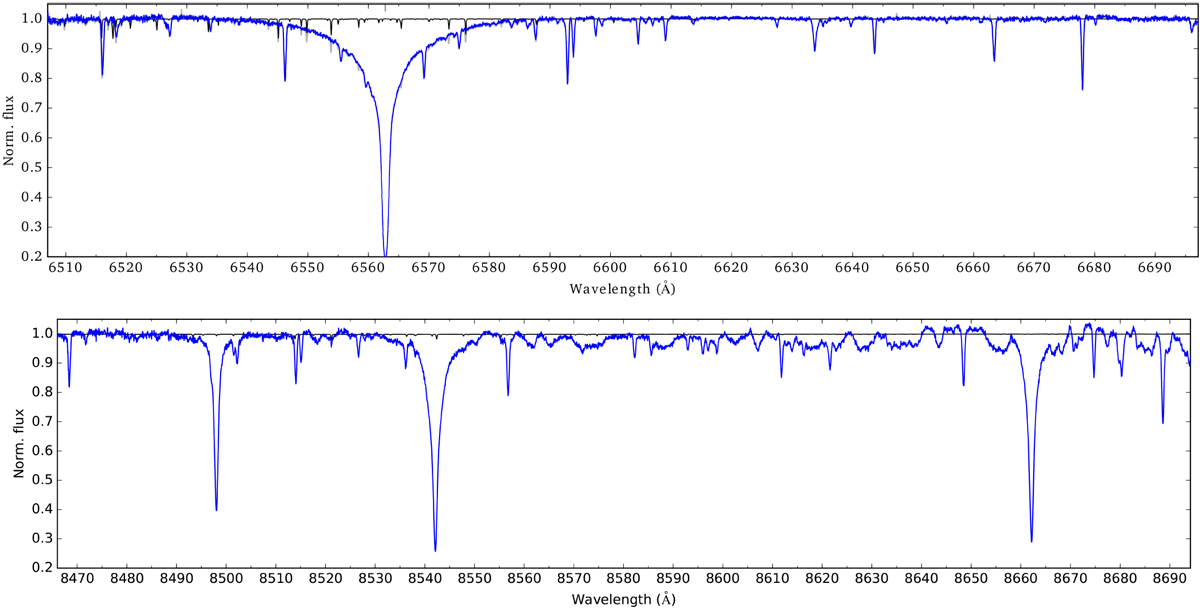
Average Hα and Ca II IRT spectra (blue). Black lines show a telluric transmission spectrum used for the telluric correction in the Hα region. The uncorrected spectrum is shown in gray in the Hα panel.
Current usage metrics show cumulative count of Article Views (full-text article views including HTML views, PDF and ePub downloads, according to the available data) and Abstracts Views on Vision4Press platform.
Data correspond to usage on the plateform after 2015. The current usage metrics is available 48-96 hours after online publication and is updated daily on week days.
Initial download of the metrics may take a while.