Fig. 9
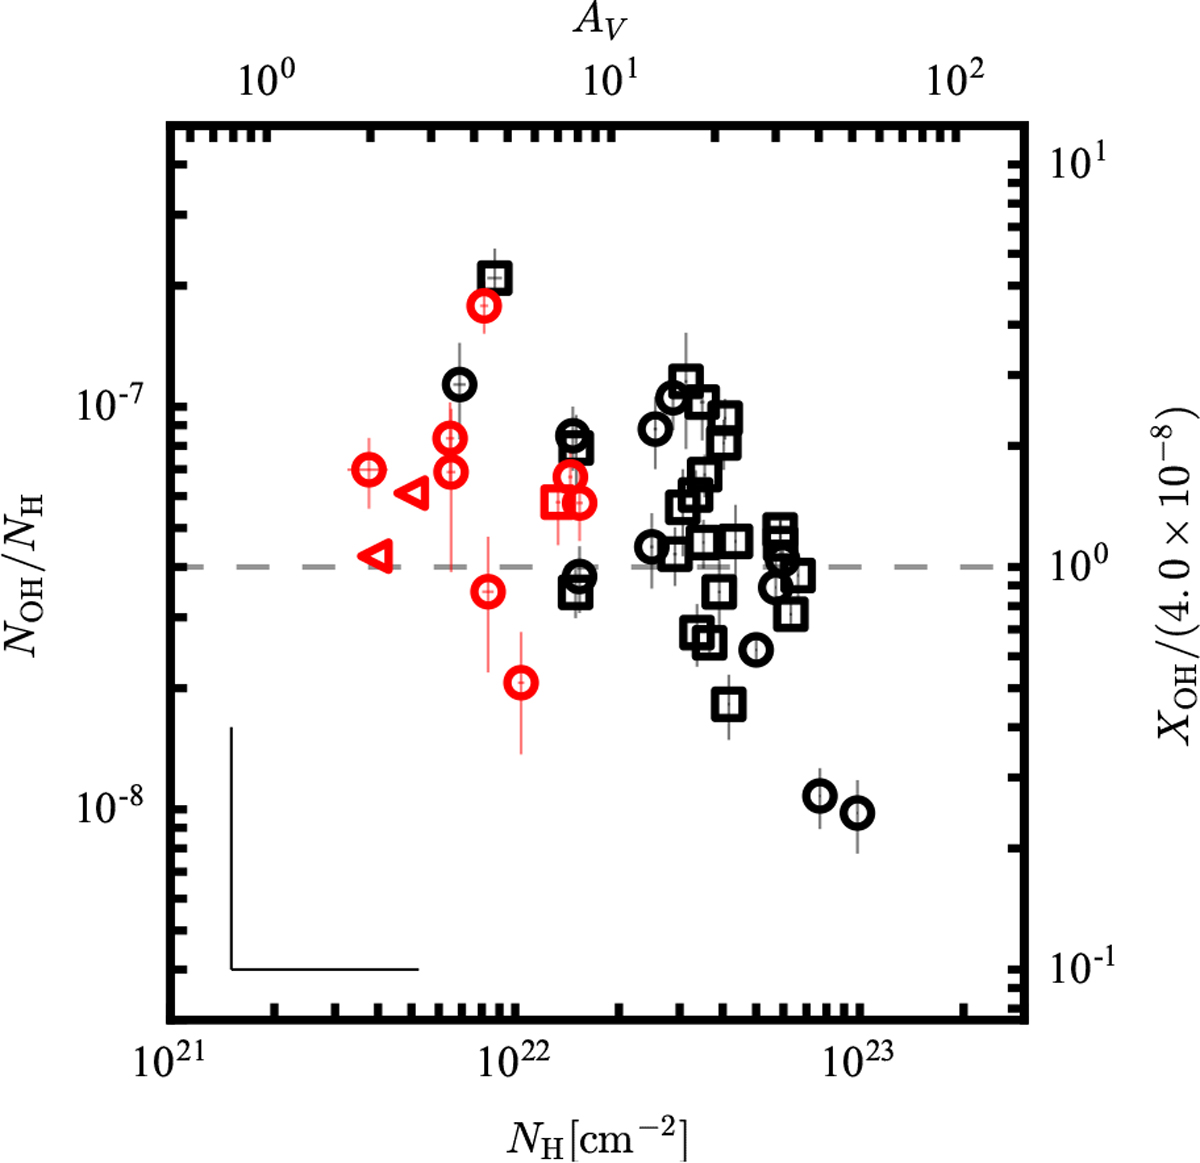
OH abundance XOH = NOH∕NH vs. NH. The total column density of hydrogen nuclei, NH, is inferred from 13CO(1–0) emission and H I absorption. As the H I column density represents lower limits, the OH abundances represent upper limits. Colors and symbols are as in Fig. 8. The right axis shows the OH abundance in units of the typical OH abundance in diffuse clouds of 4 × 10⁻⁸ (Crutcher 1979, indicated also by the dashed gray line).
Current usage metrics show cumulative count of Article Views (full-text article views including HTML views, PDF and ePub downloads, according to the available data) and Abstracts Views on Vision4Press platform.
Data correspond to usage on the plateform after 2015. The current usage metrics is available 48-96 hours after online publication and is updated daily on week days.
Initial download of the metrics may take a while.