Fig. 8
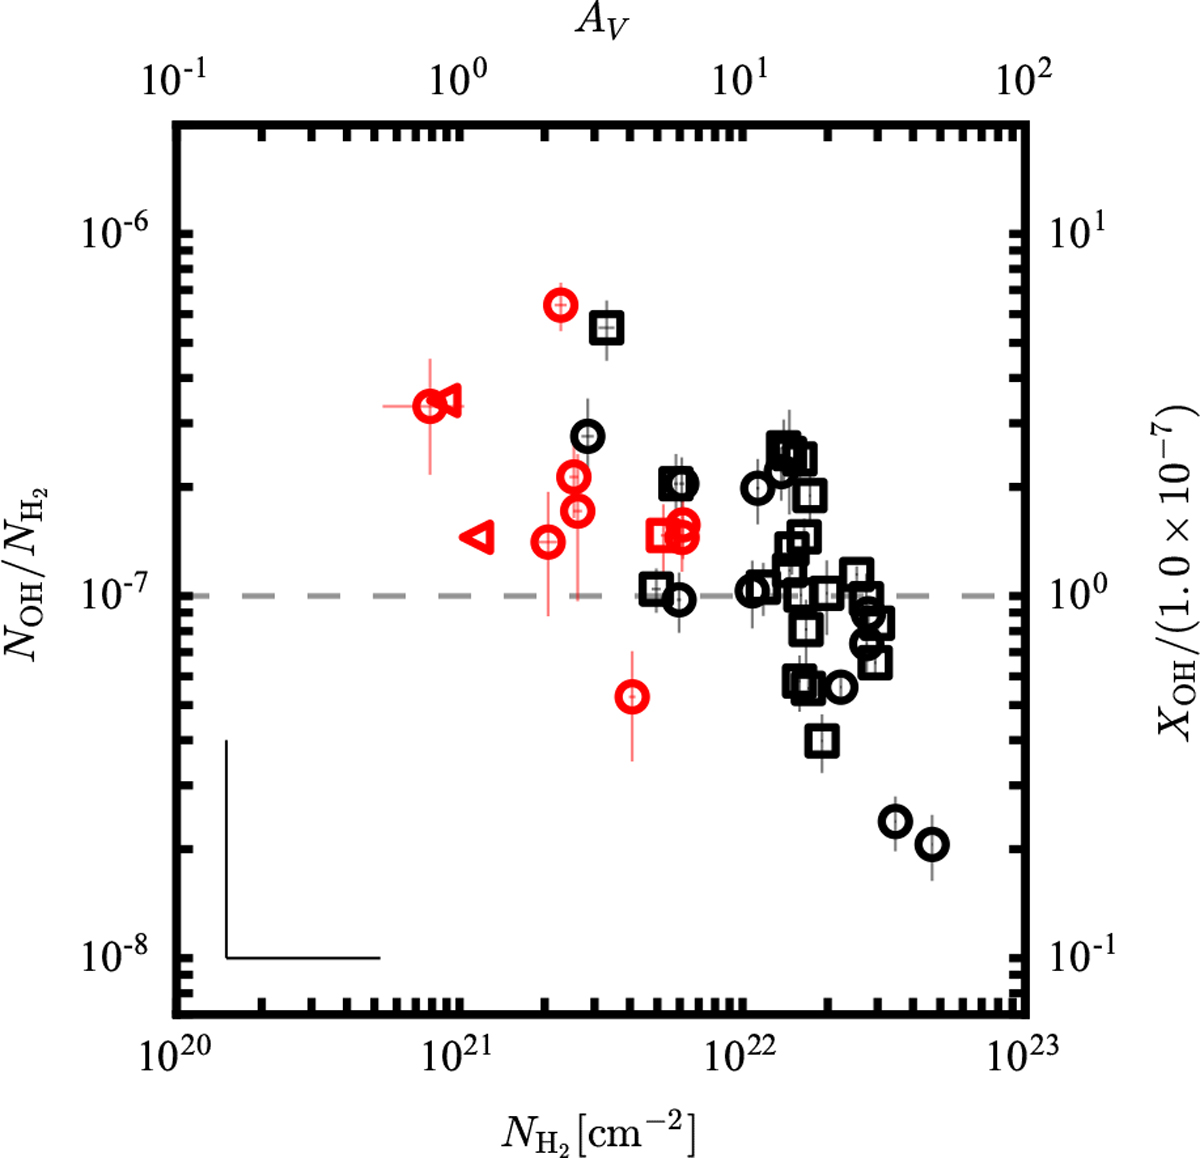
OH abundance ![]() vs.
vs. ![]() . NOH is inferred from 1665 MHz (squares) or 1667 MHz absorption (circles) and
. NOH is inferred from 1665 MHz (squares) or 1667 MHz absorption (circles) and ![]() from 13CO(1–0) emission. Absorption features associated with H II regions are shown in black; those not associated are shown in red. Triangles denote upper limits on
from 13CO(1–0) emission. Absorption features associated with H II regions are shown in black; those not associated are shown in red. Triangles denote upper limits on ![]() (inferred from the non-detection of 13CO). The right axis shows the OH abundance in units of literature (molecular) OH abundance of 1 × 10⁻⁷ (e.g., Liszt & Lucas 1999, 2002, indicated also by the dashed gray line). The black error bars in the lower left corner show the systematic errors (only the upper halfs of the error bars are shown here).
(inferred from the non-detection of 13CO). The right axis shows the OH abundance in units of literature (molecular) OH abundance of 1 × 10⁻⁷ (e.g., Liszt & Lucas 1999, 2002, indicated also by the dashed gray line). The black error bars in the lower left corner show the systematic errors (only the upper halfs of the error bars are shown here).
Current usage metrics show cumulative count of Article Views (full-text article views including HTML views, PDF and ePub downloads, according to the available data) and Abstracts Views on Vision4Press platform.
Data correspond to usage on the plateform after 2015. The current usage metrics is available 48-96 hours after online publication and is updated daily on week days.
Initial download of the metrics may take a while.