Fig. 7
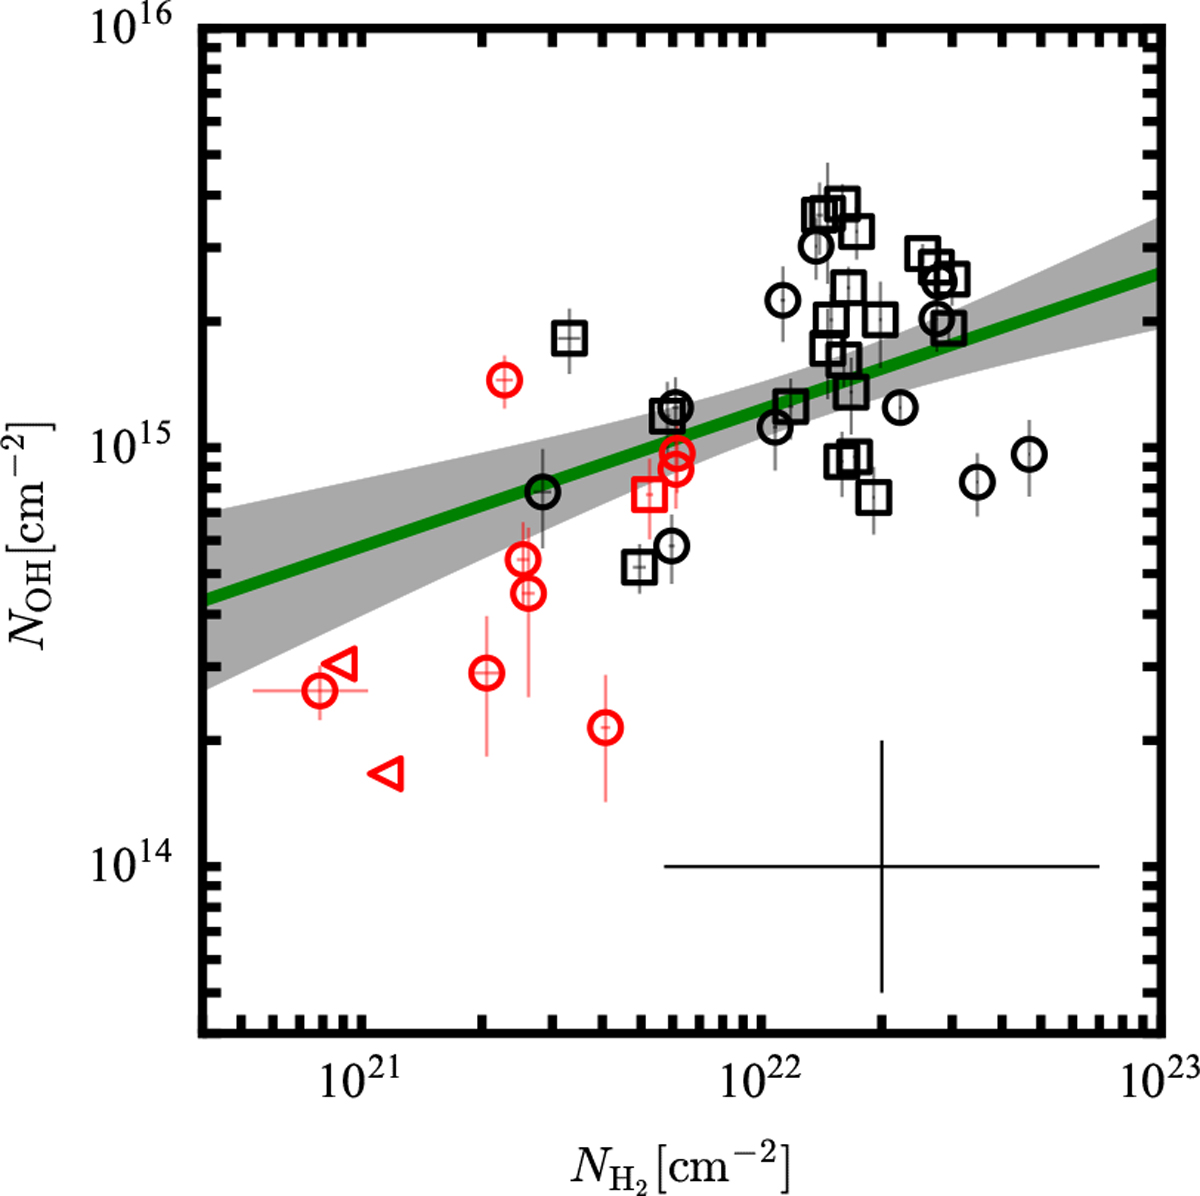
Comparison of the OH column density from the 1665 MHz (squares) and 1667 MHz transitions (circles) to that of H2 as inferred from 13CO(1–0) emission. Column densities from absorption features overlapping in velocity with H II regions (black) and with no such counterpart (red) divide the plot into regions with higher and lower hydrogen column densities. Triangles denote upper limits on ![]() as determined from 13CO(1–0) non-detections. The green line is the result of parameter estimation of a correlation between NOH and
as determined from 13CO(1–0) non-detections. The green line is the result of parameter estimation of a correlation between NOH and ![]() , using errors on x and y axes and not including upper limits. The gray shaded regions shows the 16%- and 84%-percentiles. The black error bars in the lower right corner show the systematic errors.
, using errors on x and y axes and not including upper limits. The gray shaded regions shows the 16%- and 84%-percentiles. The black error bars in the lower right corner show the systematic errors.
Current usage metrics show cumulative count of Article Views (full-text article views including HTML views, PDF and ePub downloads, according to the available data) and Abstracts Views on Vision4Press platform.
Data correspond to usage on the plateform after 2015. The current usage metrics is available 48-96 hours after online publication and is updated daily on week days.
Initial download of the metrics may take a while.