Free Access
Fig. 3
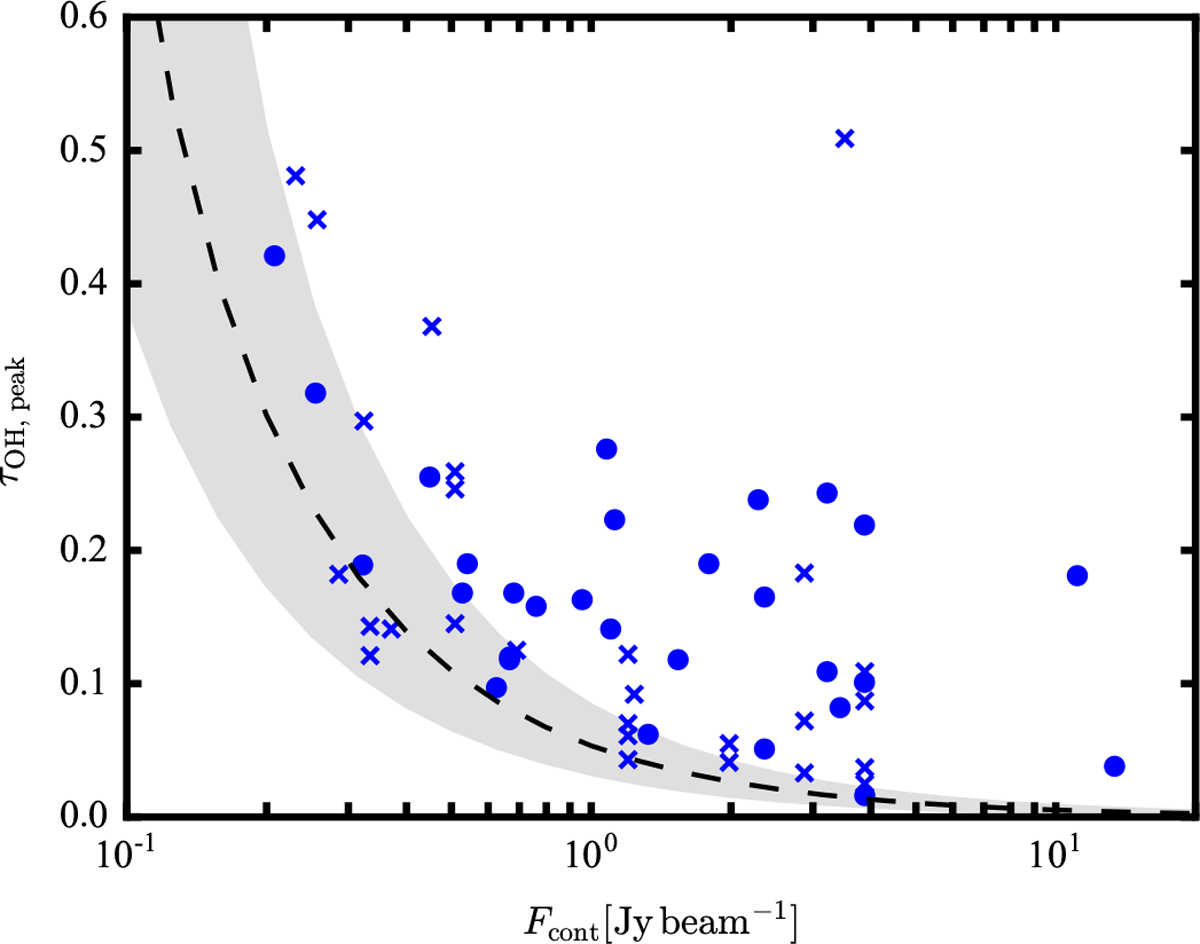
Peak optical depth of the 1665-MHz transition (circles) and the 1667-MHz transition (crosses) vs. continuum flux density at 46′′. The sensitivity in OH optical depth is indicated by an average 4σ detection limit (black dashed curve). Variations in the detection limit among sightlines are indicated by the gray shaded area.
Current usage metrics show cumulative count of Article Views (full-text article views including HTML views, PDF and ePub downloads, according to the available data) and Abstracts Views on Vision4Press platform.
Data correspond to usage on the plateform after 2015. The current usage metrics is available 48-96 hours after online publication and is updated daily on week days.
Initial download of the metrics may take a while.