Fig. E.1
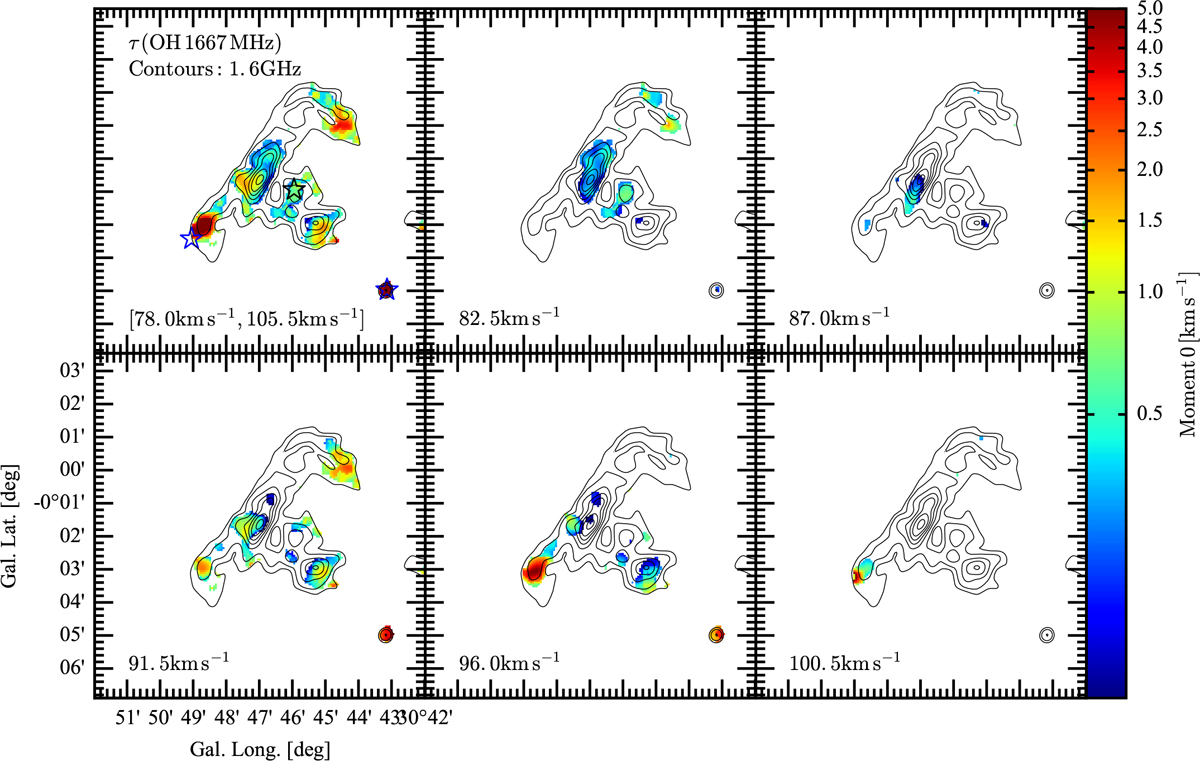
Integrated optical depth of the OH 1667 MHz line in the W43 star-forming region. In the top-left panel, τ is integrated over the same velocity range as in Fig. 10. The other panels show τ around the indicated velocities after integrating over three channels of 1.5 km s−1 width. For each pixel, only channels that are detected at a 3σ level or higher contribute to the integrated τ-map. The optical depth map is overlayed with contours of the 18 cm continuum emission (black, in levels of 0.1, 0.2, 0.4, 0.6, 0.8, 1.0, 1.25, 1.5, and 1.75 Jy beam−1). Symbols as in Fig. 10.
Current usage metrics show cumulative count of Article Views (full-text article views including HTML views, PDF and ePub downloads, according to the available data) and Abstracts Views on Vision4Press platform.
Data correspond to usage on the plateform after 2015. The current usage metrics is available 48-96 hours after online publication and is updated daily on week days.
Initial download of the metrics may take a while.