Free Access
Fig. 2
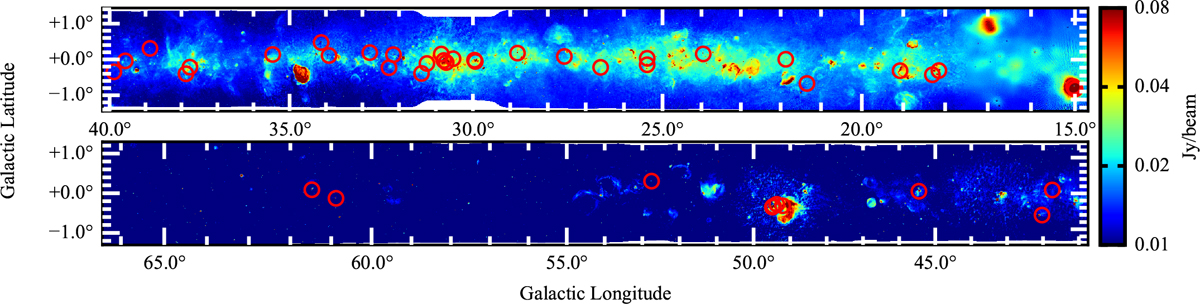
Detections of OH absorption at 1665 and 1667 MHz (red circles) overplotted on continuum emission at 1.4 GHz from the combined THOR and VGPS data (Beuther et al. 2016; Wang et al. 2018).
Current usage metrics show cumulative count of Article Views (full-text article views including HTML views, PDF and ePub downloads, according to the available data) and Abstracts Views on Vision4Press platform.
Data correspond to usage on the plateform after 2015. The current usage metrics is available 48-96 hours after online publication and is updated daily on week days.
Initial download of the metrics may take a while.