Fig. D.1
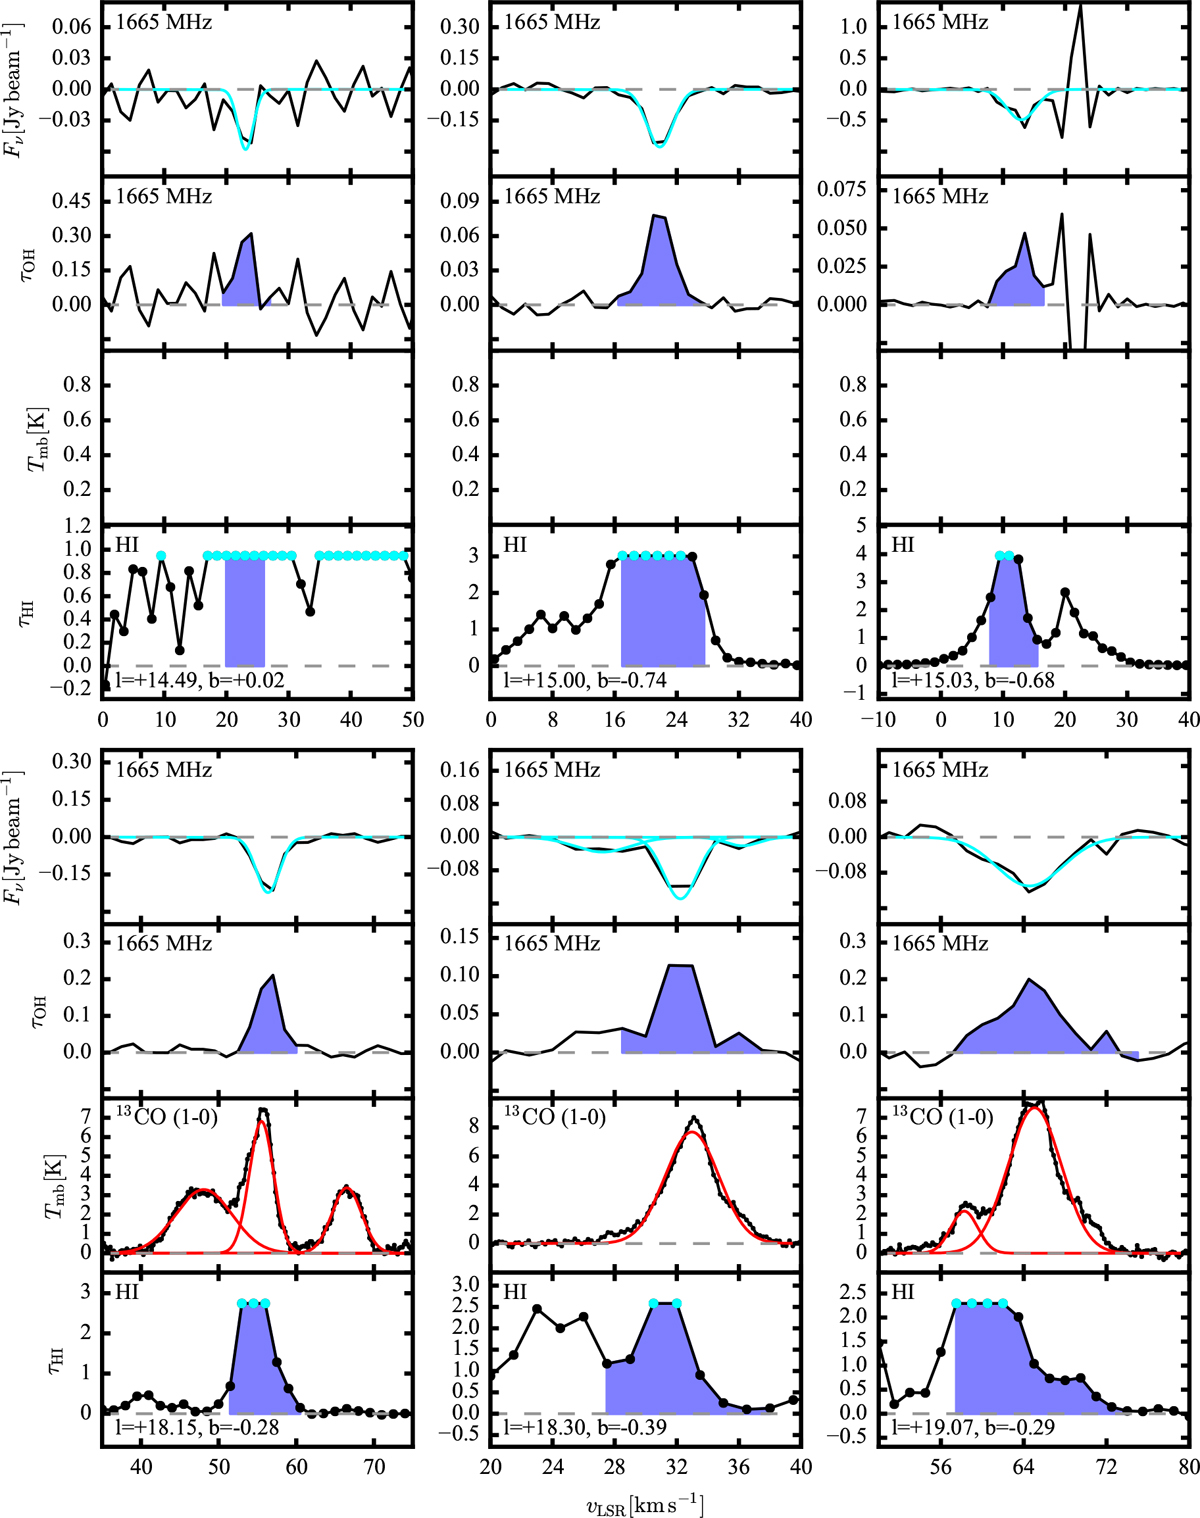
Analyzed 1665 and 1667 MHz OH absorption features. Topmost panel: 1665 MHz (black) and 1667 MHz (green) absorption features. Second panel from the top: spectrum converted to optical depth for the 1665 MHz (black) and 1667 MHz (green) transition. Third panel from the top: 13CO (1−0) emission in Tmb (data from the GRS survey (l < 60°) and Exeter FCRAO CO survey (l > 60°); Jackson et al. 2006, Mottram & Brunt 2010). The line widths were determined by fitting Gaussian profiles to the 1665 MHz (cyan) and 1667 MHz (orange) absorption, and the 13CO (1−0) emission (red). Lowermost panel: H I absorption converted to H I optical depth. Measured bins are denoted by black dots, while we quote lower limits (cyan) for saturated bins. The 1667 MHz transition was observed only towards selected regions and is therefore shown only for a subset of lines-of-sight (see Sect. 2). Theline-of-sight coordinates are given in degrees of Galactic coordinates. The blue shaded area in the lower three panels shows the line integrals. All data were smoothed to a spatial resolution of 46′′.
Current usage metrics show cumulative count of Article Views (full-text article views including HTML views, PDF and ePub downloads, according to the available data) and Abstracts Views on Vision4Press platform.
Data correspond to usage on the plateform after 2015. The current usage metrics is available 48-96 hours after online publication and is updated daily on week days.
Initial download of the metrics may take a while.