Fig. C.1
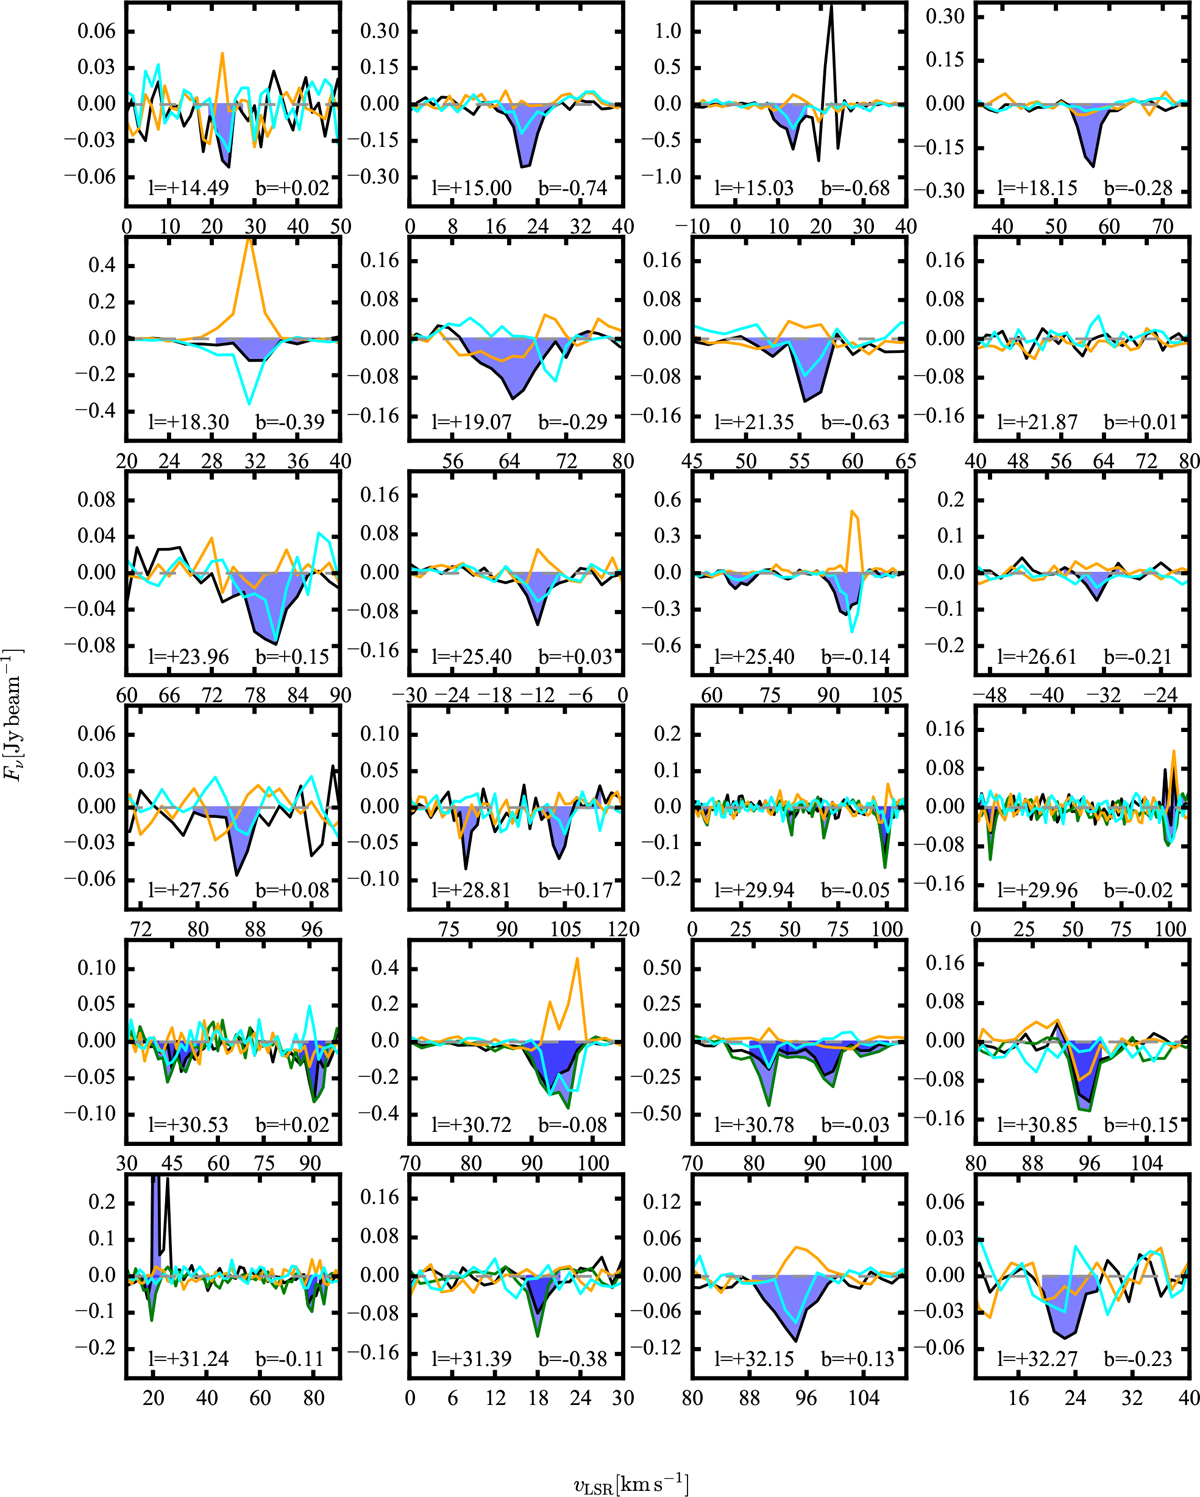
Spectra of OH ground state transitions, especially also of the satellite lines, along lines of sight that show a detection in 1665 or 1667 MHz absorption. The spectra are extracted from data cubes that have been smoothed to 46′′ resolution. The transitions at 1665 MHz (black), 1612 MHz (orange), and 1720 MHz (cyan) are shown for all sources. The 1667 MHz (green) transition is displayed if available. OH absorption detections in the main line transitions are shaded in blue.
Current usage metrics show cumulative count of Article Views (full-text article views including HTML views, PDF and ePub downloads, according to the available data) and Abstracts Views on Vision4Press platform.
Data correspond to usage on the plateform after 2015. The current usage metrics is available 48-96 hours after online publication and is updated daily on week days.
Initial download of the metrics may take a while.