Fig. 13
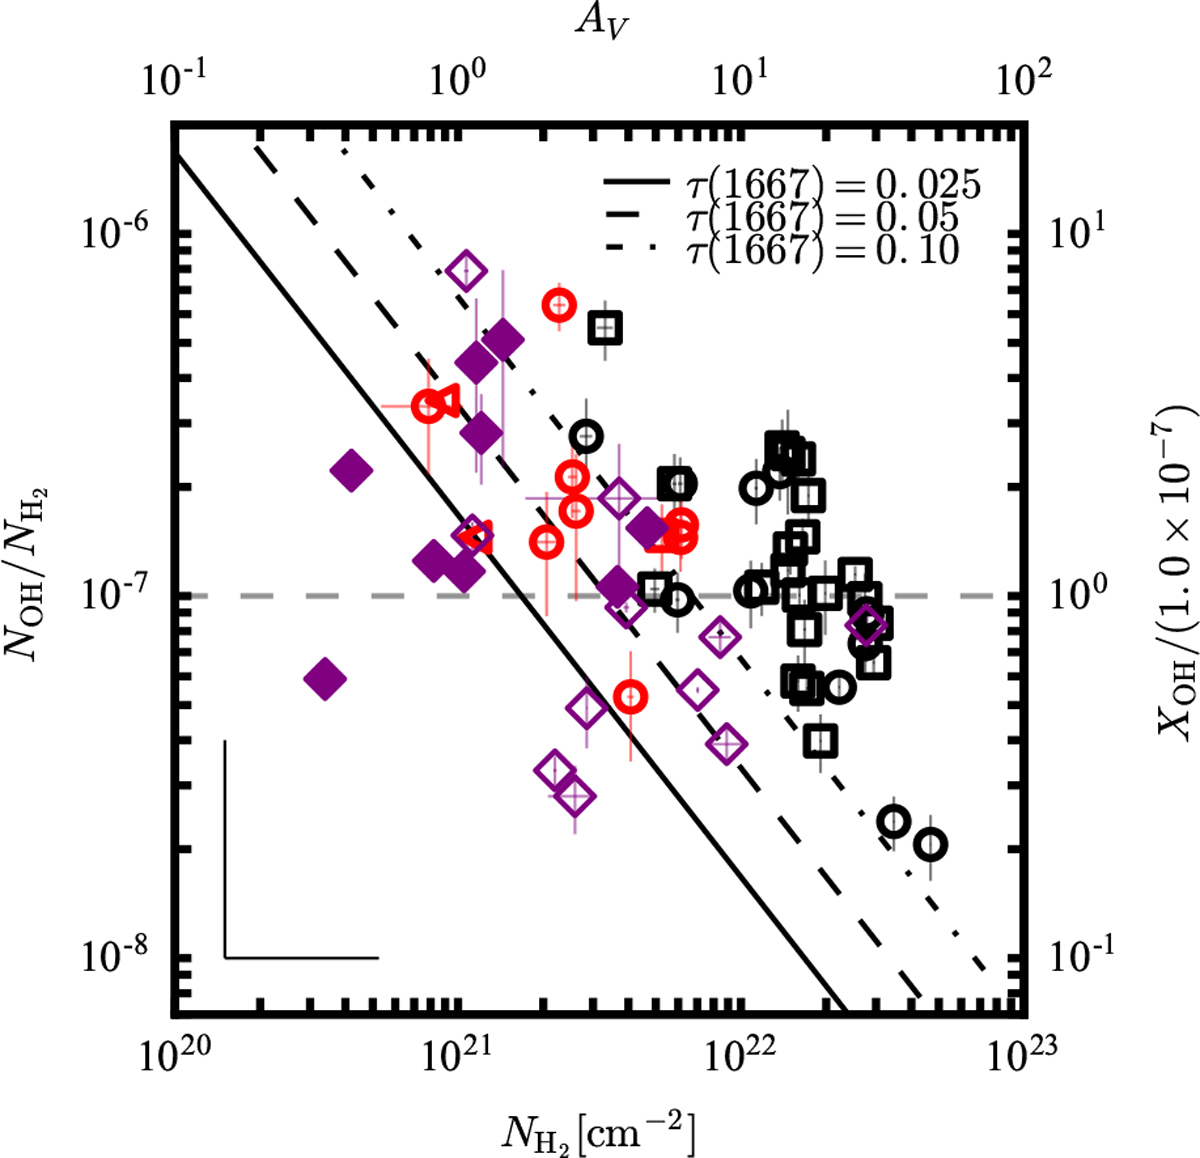
Comparison of the OH molecular abundances from this work to abundances measured in Wiesemeyer et al. (2016). Data, symbols and systematic uncertainties as in Fig. 8. Measurements from Table 4 of Wiesemeyer et al. (2016) are overplotted as purple diamonds. Filled diamonds use HF as proxy for the H2 column density. Empty diamonds use CH. If both HF and CH measurements are available, OH measurements are drawn twice. Black diagonal lines indicate sensitivity limits of XOH for typical 4σ limits on optical depth in the OH main lines and assuming a line width of 2.5 km s −1 (the detection limits of τ = 0.025, 0.05 and 0.1 are acchieved for continuum sources stronger than Fcont = 2.10, 1.05 and 0.53 Jy beam−1, respectively).
Current usage metrics show cumulative count of Article Views (full-text article views including HTML views, PDF and ePub downloads, according to the available data) and Abstracts Views on Vision4Press platform.
Data correspond to usage on the plateform after 2015. The current usage metrics is available 48-96 hours after online publication and is updated daily on week days.
Initial download of the metrics may take a while.