Fig. 11
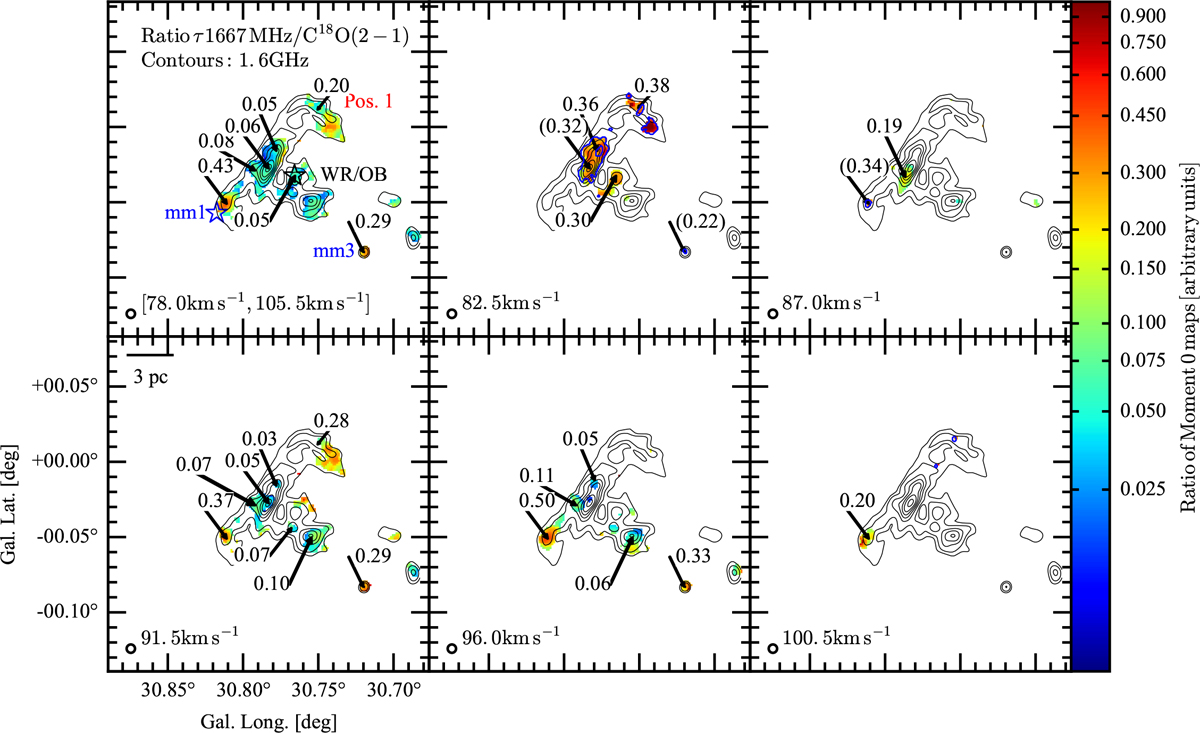
Ratio of integrated τ(OH 1667 MHz) absorption and C18O(2–1) emission in W43. The top-left panel is the same as the rightmost panel in Fig. 10 and is shown for orientation. The other panels show the ratio of τ(OH 1667 MHz) and C18 O(2–1) at the indicated velocities after binning three channels of 1.5 km s−1 width. Overlayed on all panels are contours of 18 cm continuum emission (black, in levels of 0.1, 0.2, 0.4, 0.6, 0.8, 1.0, 1.25, 1.5 and 1.75 Jy beam−1). The 1667 MHz optical depth has been masked at 3σ detection levels in the original OH absorption data. For pixels with no C18O emission counterpart, 3σ detection limits have been used, and are indicated by blue contours. The ratio is quoted in brackets for these locations.
Current usage metrics show cumulative count of Article Views (full-text article views including HTML views, PDF and ePub downloads, according to the available data) and Abstracts Views on Vision4Press platform.
Data correspond to usage on the plateform after 2015. The current usage metrics is available 48-96 hours after online publication and is updated daily on week days.
Initial download of the metrics may take a while.