Fig. 10
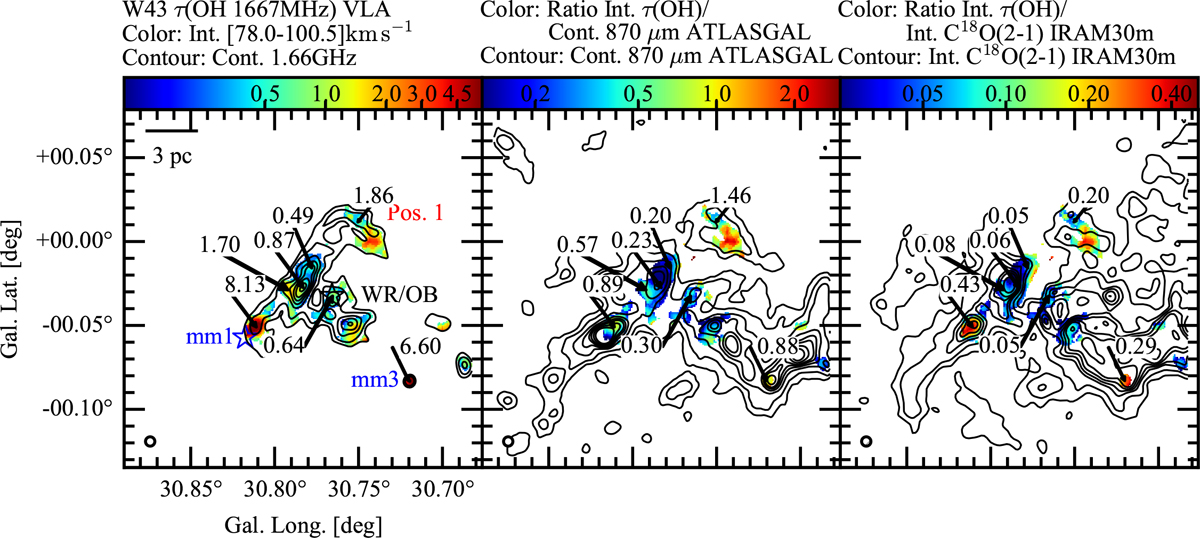
Comparison of τ(OH 1667 MHz), dust continuum emission at λ = 870 μm, and C18 O(2–1) emission in the W43 star-forming region. In the left panel, the integrated optical depth of the OH 1667 MHz transition between 78.0and 100.5 km s−1 is displayed in colors. For each pixel, only channels that are detected at a 3σ level contribute to the integrated τ-map. It is overlayed with contours of the 18 cm continuum emission (black, at levels of 0.1, 0.2, 0.4, 0.6, 0.8, 1.0, 1.25, 1.5 and 1.75 Jy beam−1). Middle panel: ratio of the integrated τ(OH) map to 870 μm ATLASGAL emission (Schuller et al. 2009), which traces dense gas (the dust emission is overlayed in black contours, at levels of 0.5, 1.0, 2.0, 3.0, 4.0, 5.0, 7.0 and 10.0 Jy beam−1). Right panel: ratio of τ(OH) to C18 O(2–1) emission (Carlhoff et al. 2013), integrated over the same velocity range (the velocity integrated C18 O(2–1) emission is overplotted in black contours at levels of 6, 9, 13, 15, 17, 19, 23 K km s −1). All data have been smoothed to a common resolution of 20′′, corresponding to spatial scales of 0.5 pc. In the left panel, the central Wolf–Rayet/OB cluster is marked by a black star, while the dense clumps MM1 and MM3 (Motte et al. 2003) are marked by blue stars. The upper end of the T-bar-shaped continuum emission is marked as Pos. 1 for easier reference in the text. For readability, the values of the ratio are displayed for selected positions in the figure.
Current usage metrics show cumulative count of Article Views (full-text article views including HTML views, PDF and ePub downloads, according to the available data) and Abstracts Views on Vision4Press platform.
Data correspond to usage on the plateform after 2015. The current usage metrics is available 48-96 hours after online publication and is updated daily on week days.
Initial download of the metrics may take a while.