Fig. 1
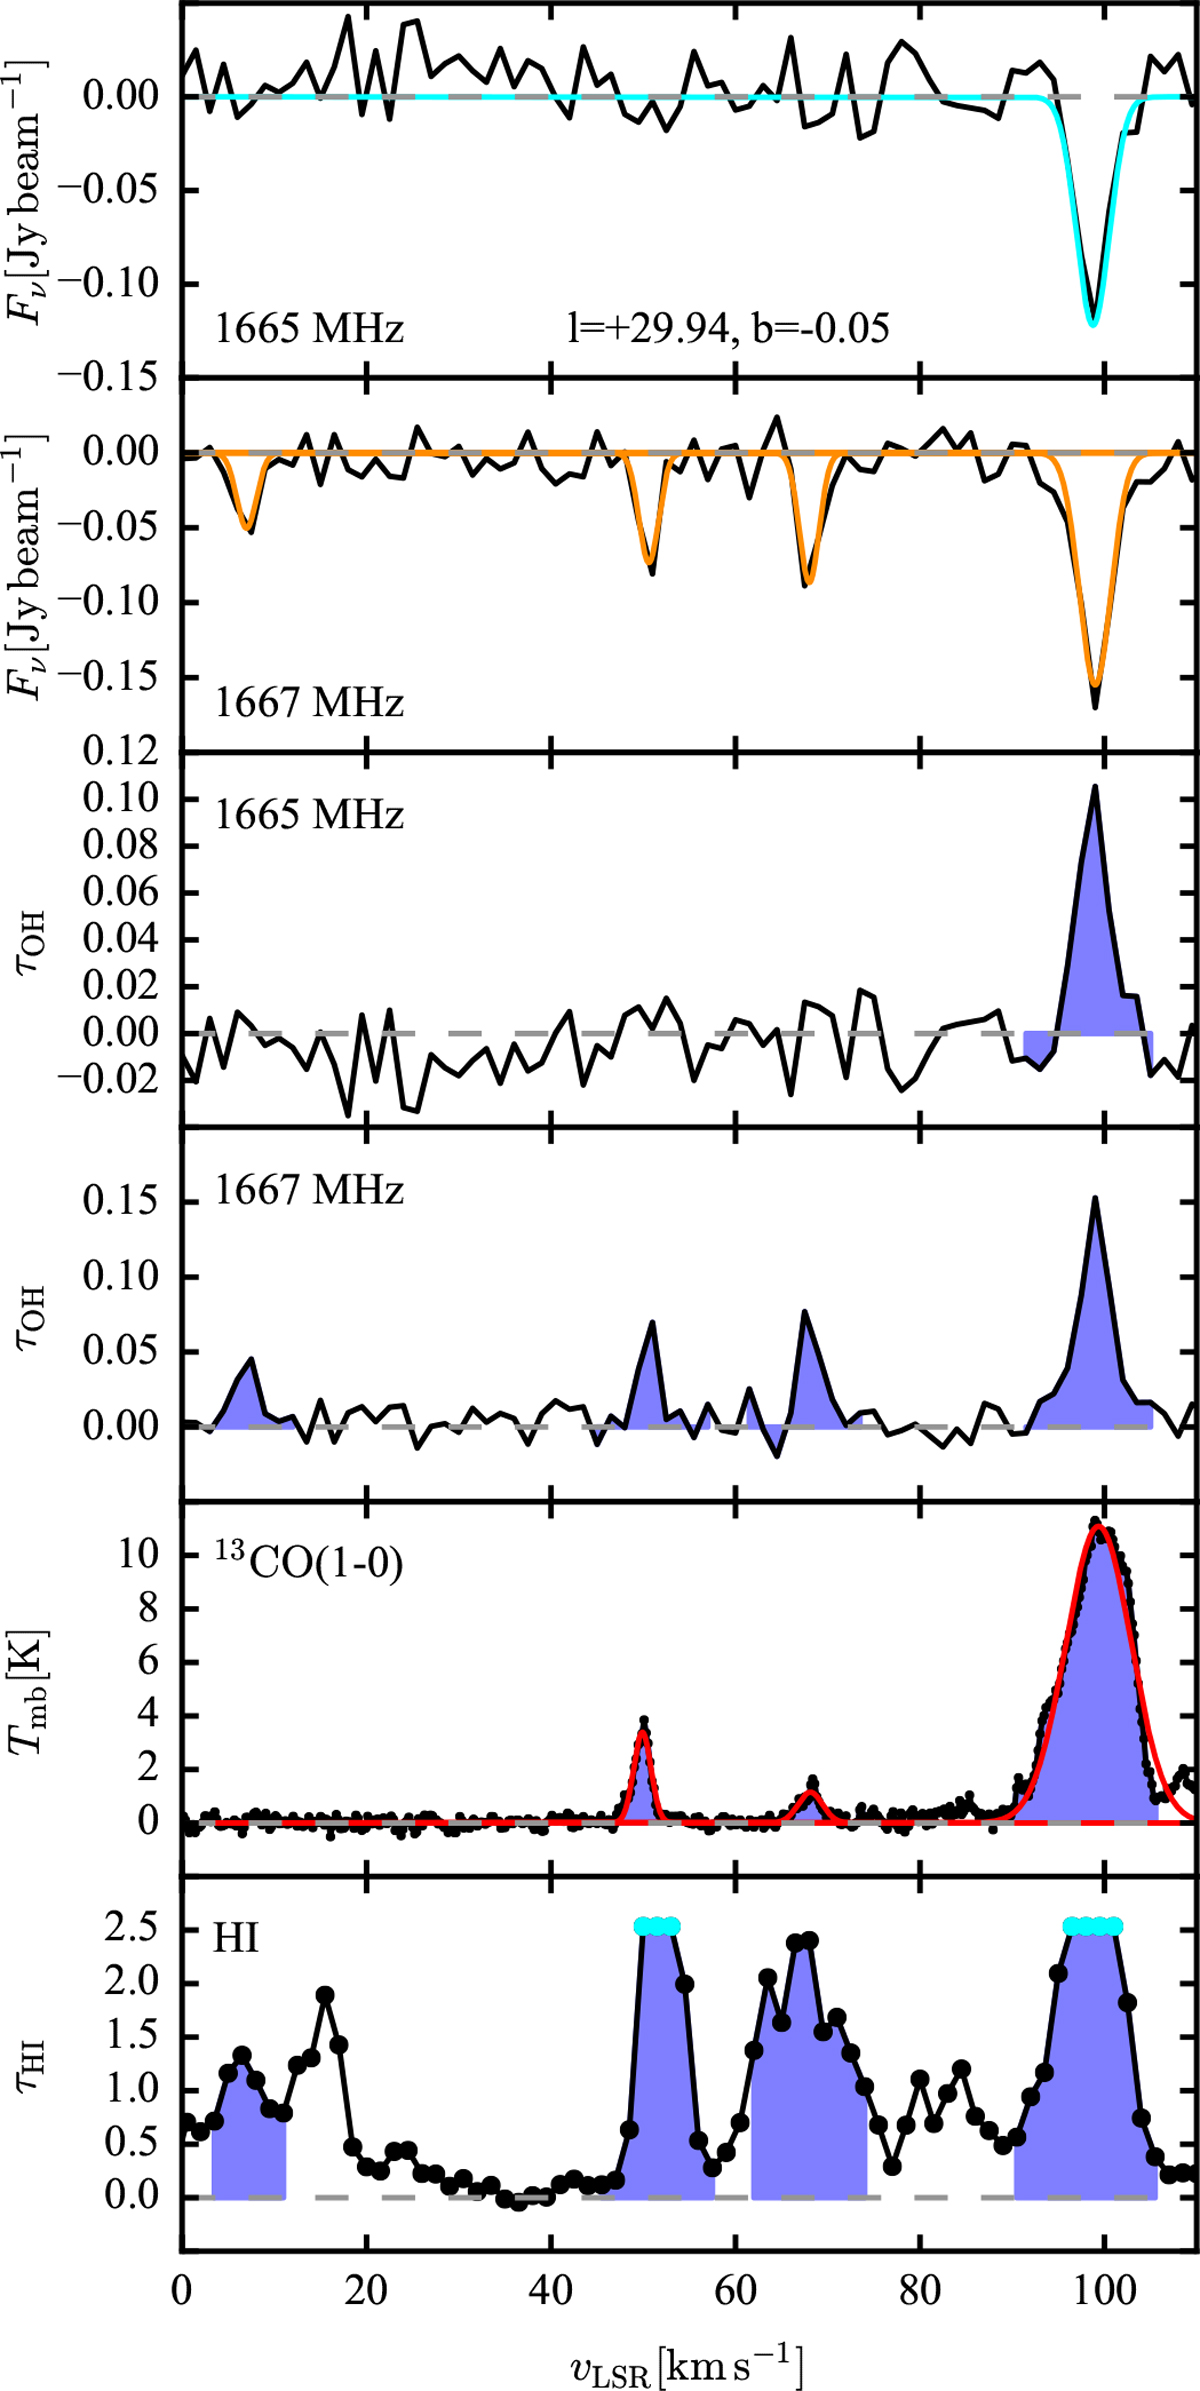
Example spectra and optical depths at l = +29.935°, b = −0.053° (at 46″ resolution). Topmost two panels: 1665 and 1667 MHz absorption features. The fitted Gaussian profiles for the 1665 MHz line (cyan) and 1667 MHz line (orange) are overlaid. Two middle panels: optical depth of the 1665 and 1667 MHz transitions. Second panel from the bottom: emission of 13CO (1–0) in main-beam temperature (Tmb), overlaid with a fitted Gaussian profile (red). Lowermost panel: H I optical depth as measured from the absorption spectra. Lower limits (cyan dots) are given for saturated bins. The blue shaded area in the lower four panels denotes the area of the transitions, from which the column densities are determined.
Current usage metrics show cumulative count of Article Views (full-text article views including HTML views, PDF and ePub downloads, according to the available data) and Abstracts Views on Vision4Press platform.
Data correspond to usage on the plateform after 2015. The current usage metrics is available 48-96 hours after online publication and is updated daily on week days.
Initial download of the metrics may take a while.