Fig. 6.
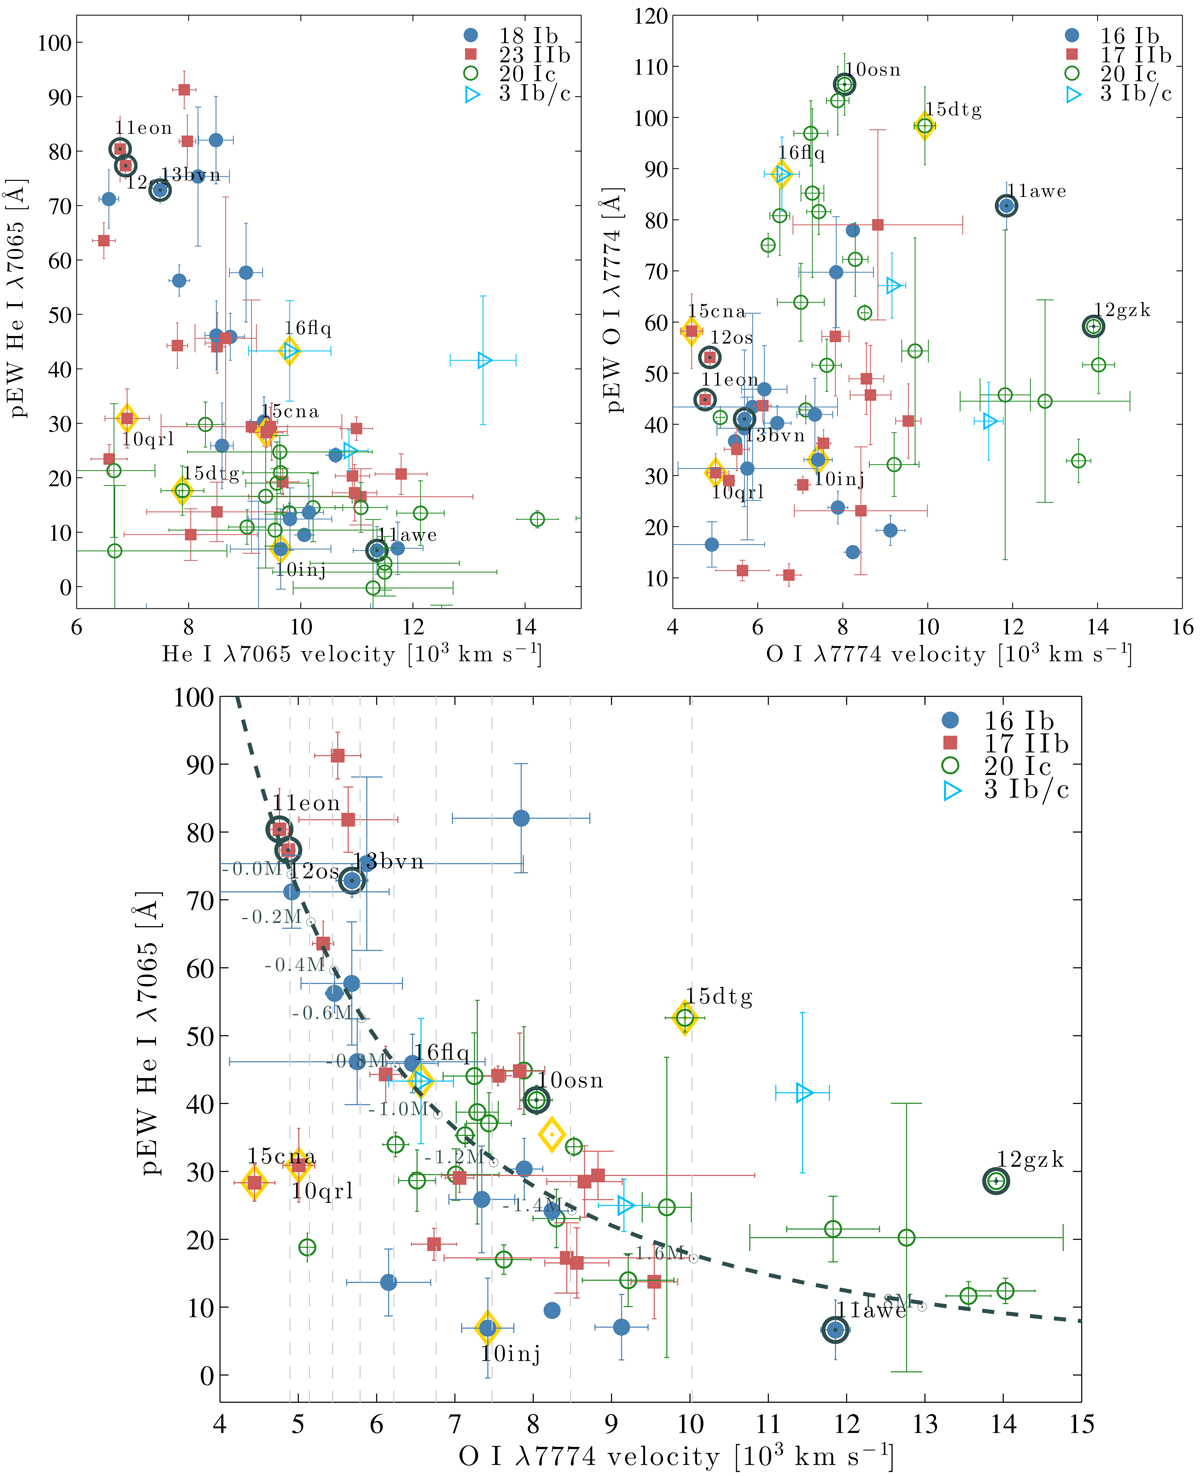
Average pEW vs. velocity of He I λ7065 between +10 and +20 d (top-left panel). Average pEW vs. velocity of O I λ7774 between +10 and +20 d (top-right panel). Average pEW of He I λ7065 vs. velocity of O I λ7774 between +10 d and +20 d for SNe IIb and Ib, and the pEW of O I λ7774 scaled down by a factor of 2.2 vs. O I λ7774 velocity for SNe Ic (bottom panel). An illustrative set of SNe have been labeled by their abbreviated (i)PTF names. Yellow diamonds indicate all objects showing very broad LCs. In the bottom panel the thick dashed black line indicates the best-fit relation pEW∝ υ−2. The dashed vertical lines indicate the velocity increase expected from the Arnett (1982) model by removing 0.2 M⊙of material from the ejecta (the He envelope) for each line from left to right (mass-difference labels follow the thick dashed black line). The model has been scaled, so that the O I λ7774 velocity predicted for a total ejecta mass of 2.1 M⊙ is 4900 km s−1, to match the observed velocities of SN 2011dh (PTF11eon) and PTF12os. Two SNe IIb (iPTF15cna and PTF10qrl) are strong outliers from the fitted trend. These two SNe have very broad LCs and low O I λ7774 velocities (see Sect. 6 for further discussion).
Current usage metrics show cumulative count of Article Views (full-text article views including HTML views, PDF and ePub downloads, according to the available data) and Abstracts Views on Vision4Press platform.
Data correspond to usage on the plateform after 2015. The current usage metrics is available 48-96 hours after online publication and is updated daily on week days.
Initial download of the metrics may take a while.