Fig. 5.
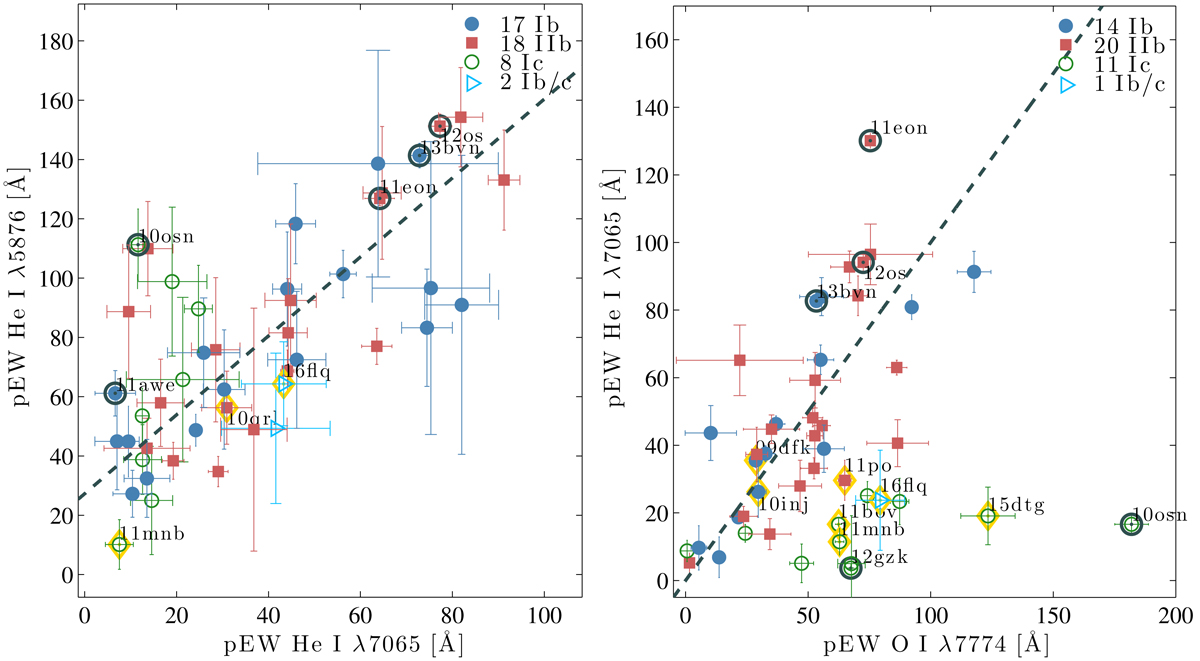
Scatter plots of average pEW values for the SE SNe in our sample. He I λ7065 vs. He I λ5876 calculated between +10 d and +20 d, along with the best-fit relation pEWλ5876 = 30 + 1.3 × pEWλ7065 as a dashed line (left panel). O I λ7774 vs. He I λ7065 at +25 d to +45 d with the best-fit relation pEWλ7065 = 1.0 × pEWλ7774 (right panel). An illustrative set of SNe have been labeled by their abbreviated (i)PTF names in both panels. Yellow diamonds indicate all objects showing very broad LCs.
Current usage metrics show cumulative count of Article Views (full-text article views including HTML views, PDF and ePub downloads, according to the available data) and Abstracts Views on Vision4Press platform.
Data correspond to usage on the plateform after 2015. The current usage metrics is available 48-96 hours after online publication and is updated daily on week days.
Initial download of the metrics may take a while.