Fig. 4.
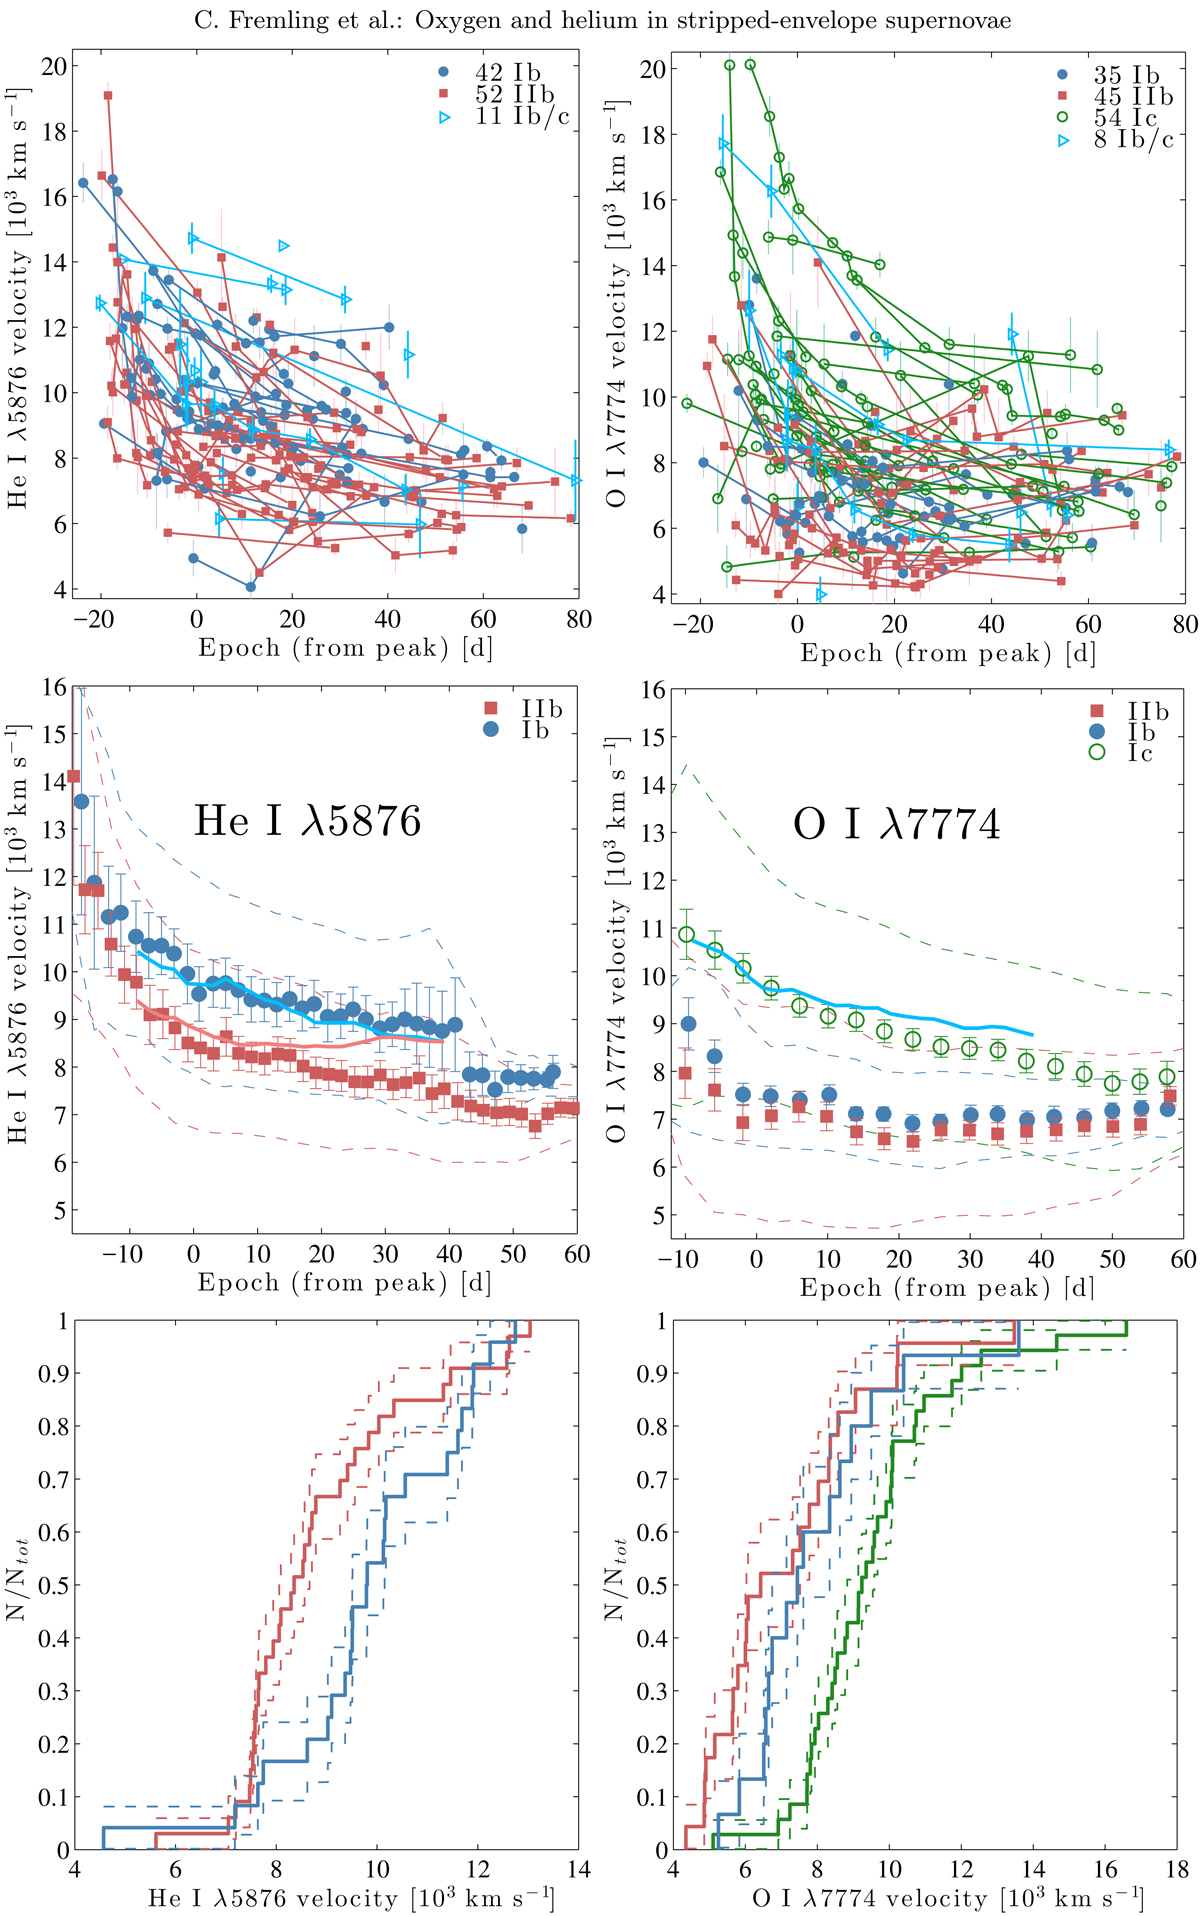
Velocities of He I λ5876 (left panels) and O I λ7774 (right panels). Top panels: individual measurements, with measurements of the same SN connected by solid lines. Middle panels: averages of the SE subtypes, with error bars representing the standard deviation of the mean. Dashed lines outline the standard deviations of the samples for each subtype in matching color. Average velocities derived from He I λ7065 are shown as thick solid lines (Type Ib in blue and Type IIb in red) in the middle-left panel. The average He I λ5876 velocity of Type Ib SNe is shown as a thick solid line in the middle-right panel. Bottom panels: CDFs measured between −10 and +10 d for each subtype.
Current usage metrics show cumulative count of Article Views (full-text article views including HTML views, PDF and ePub downloads, according to the available data) and Abstracts Views on Vision4Press platform.
Data correspond to usage on the plateform after 2015. The current usage metrics is available 48-96 hours after online publication and is updated daily on week days.
Initial download of the metrics may take a while.