Fig. 1.
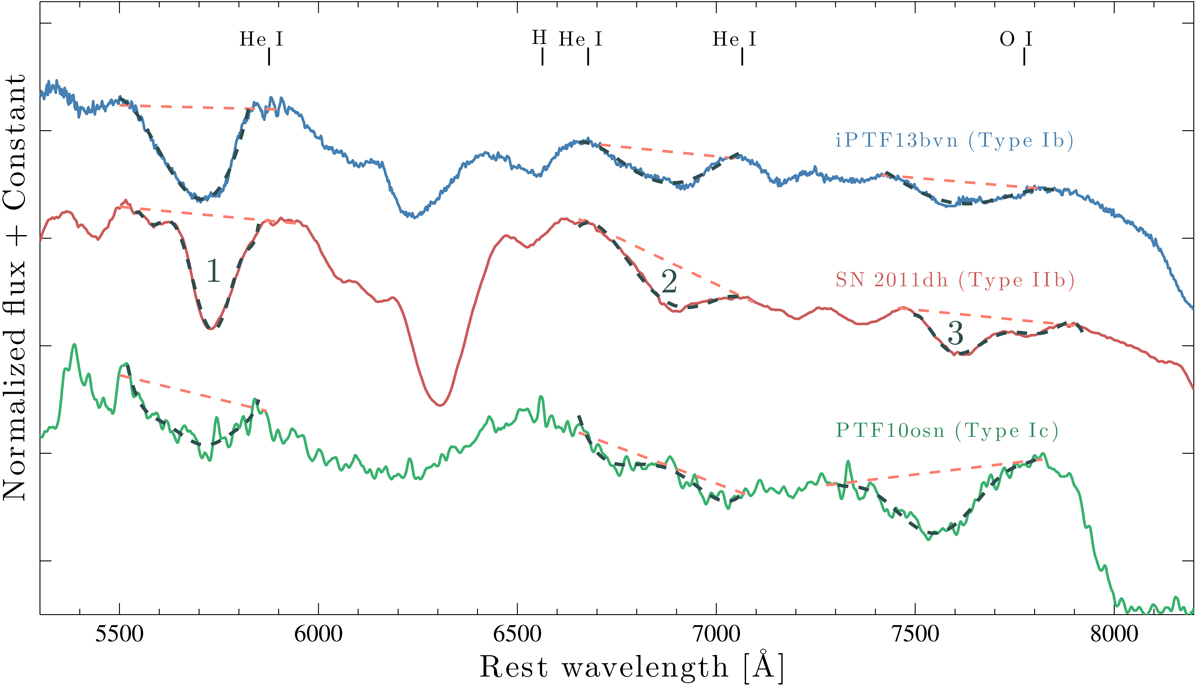
Description of our pEW and expansion-velocity measurement method using spectra around peak brightness for iPTF13bvn (Type Ib, +0.5 d, upper blue line), SN 2011dh (Type IIb, +2.5 d, middle red line), and PTF10osn (Type Ic, +4.0 d, bottom green line). On the spectrum of SN 2011dh, the absorption features of He I λλ5876, 7065 and O I λ7774 have been labeled with numbers. Measurements of features 1–3 have been attempted on all spectra in our sample. For SE SNe, feature 1 is typically associated with He I λ5876, feature 2 with He I λ7065, and feature 3 with O I λ7774, although other elements also contribute to these features. Dashed red lines indicate pseudo-continuum estimates (first-order polynomial fits) for features 1–3 resulting from our measurement scheme (Sect. 3). We calculate pEWs (e.g., Fig. 2) between the endpoints of these continuum estimates using Eq. (1). Velocity estimates are obtained by locating the minima of polynomial fits between the pseudo-continuum endpoints (order 4–7, dashed black lines). If a spectral feature is ambiguous, and has several minima within a similar range as shown for feature 2 in the spectrum of PTF10osn, we set the velocity estimate to be undefined but still calculate the pEW. Wavelengths have been shifted to the rest frame, and the spectra have been normalized and shifted by a constant for clarity.
Current usage metrics show cumulative count of Article Views (full-text article views including HTML views, PDF and ePub downloads, according to the available data) and Abstracts Views on Vision4Press platform.
Data correspond to usage on the plateform after 2015. The current usage metrics is available 48-96 hours after online publication and is updated daily on week days.
Initial download of the metrics may take a while.