Fig. 9.
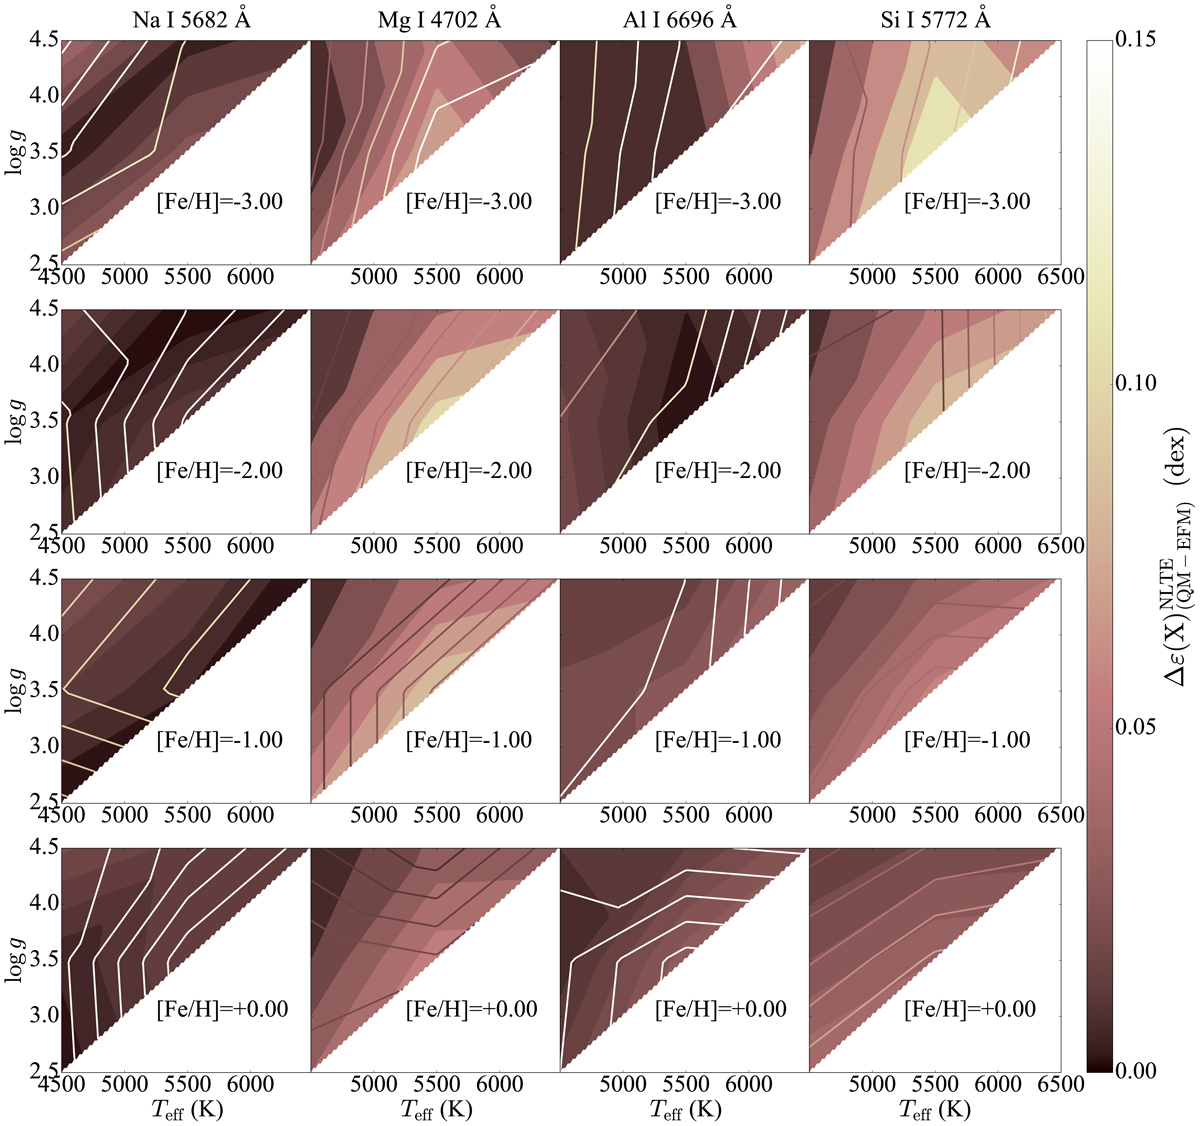
Abundance correction differences obtained between the QM and our EFM models (in absolute values) for the lines Na I 5682 Å, Mg I 4702 Å, Al I 6696 Å and Si I 5772 Å as a function of Teff and log ɡ (represented by the shaded contour plots) and [Fe/H] (upper to lower panels). For comparison, the NLTE abundance corrections (also in absolute values) obtained by the QM models are represented by the iso-contour lines on the same plots using the same color scale.
Current usage metrics show cumulative count of Article Views (full-text article views including HTML views, PDF and ePub downloads, according to the available data) and Abstracts Views on Vision4Press platform.
Data correspond to usage on the plateform after 2015. The current usage metrics is available 48-96 hours after online publication and is updated daily on week days.
Initial download of the metrics may take a while.