Fig. 6.
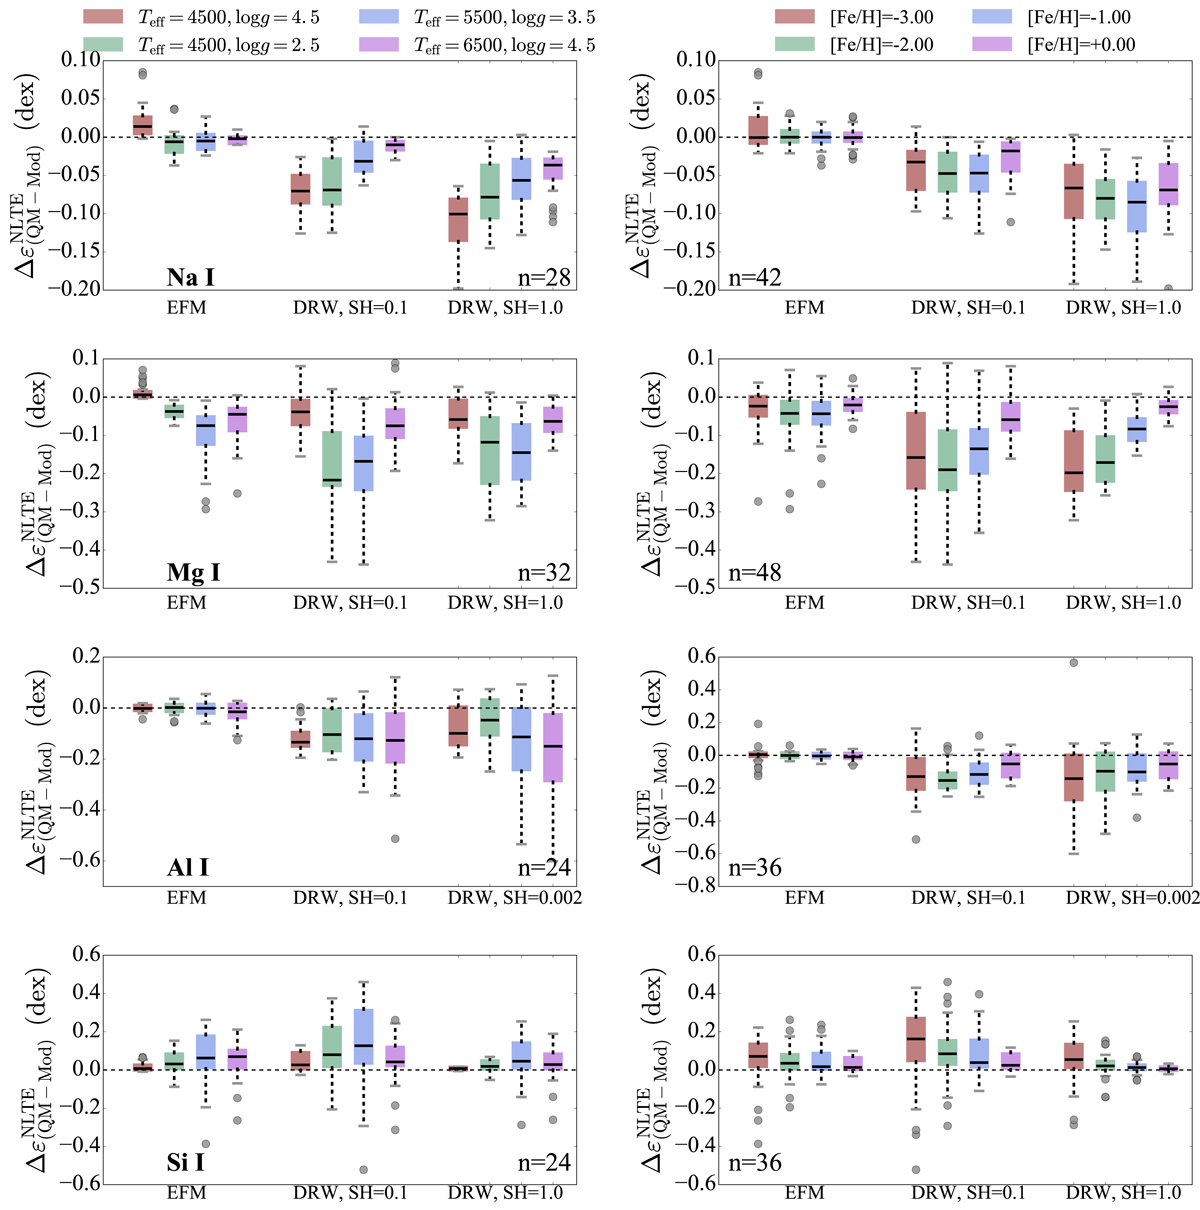
Box plots showing the overall NLTE abundance correction differences obtained between models computed with the QM rates and those computed with the EFM, DRW, SH = 0.1 and DRW, SH = 1.0 rates (for Al I, we choose to show results for DRW, SH = 0.002 instead of DRW, SH = 1.0). Boxes in each panel display the differences obtained from representative lines of Na I, Mg I, Al I and Si I (shown in Table A.1) for the corresponding stellar parameters of cool dwarfs (in red), cool giants (in green), subgiants (in blue) and warm dwarfs (in magenta) in the left-hand panels. Right-hand panels show the same plots for different metallicities. The number of lines, n, used in each box plot is displayed. Black solid lines show the median values obtained for each model and each atom, colored boxes represent 50%, and whisker edges 90% of the lines. Gray circles show the remaining outlier lines.
Current usage metrics show cumulative count of Article Views (full-text article views including HTML views, PDF and ePub downloads, according to the available data) and Abstracts Views on Vision4Press platform.
Data correspond to usage on the plateform after 2015. The current usage metrics is available 48-96 hours after online publication and is updated daily on week days.
Initial download of the metrics may take a while.