Fig. 5.
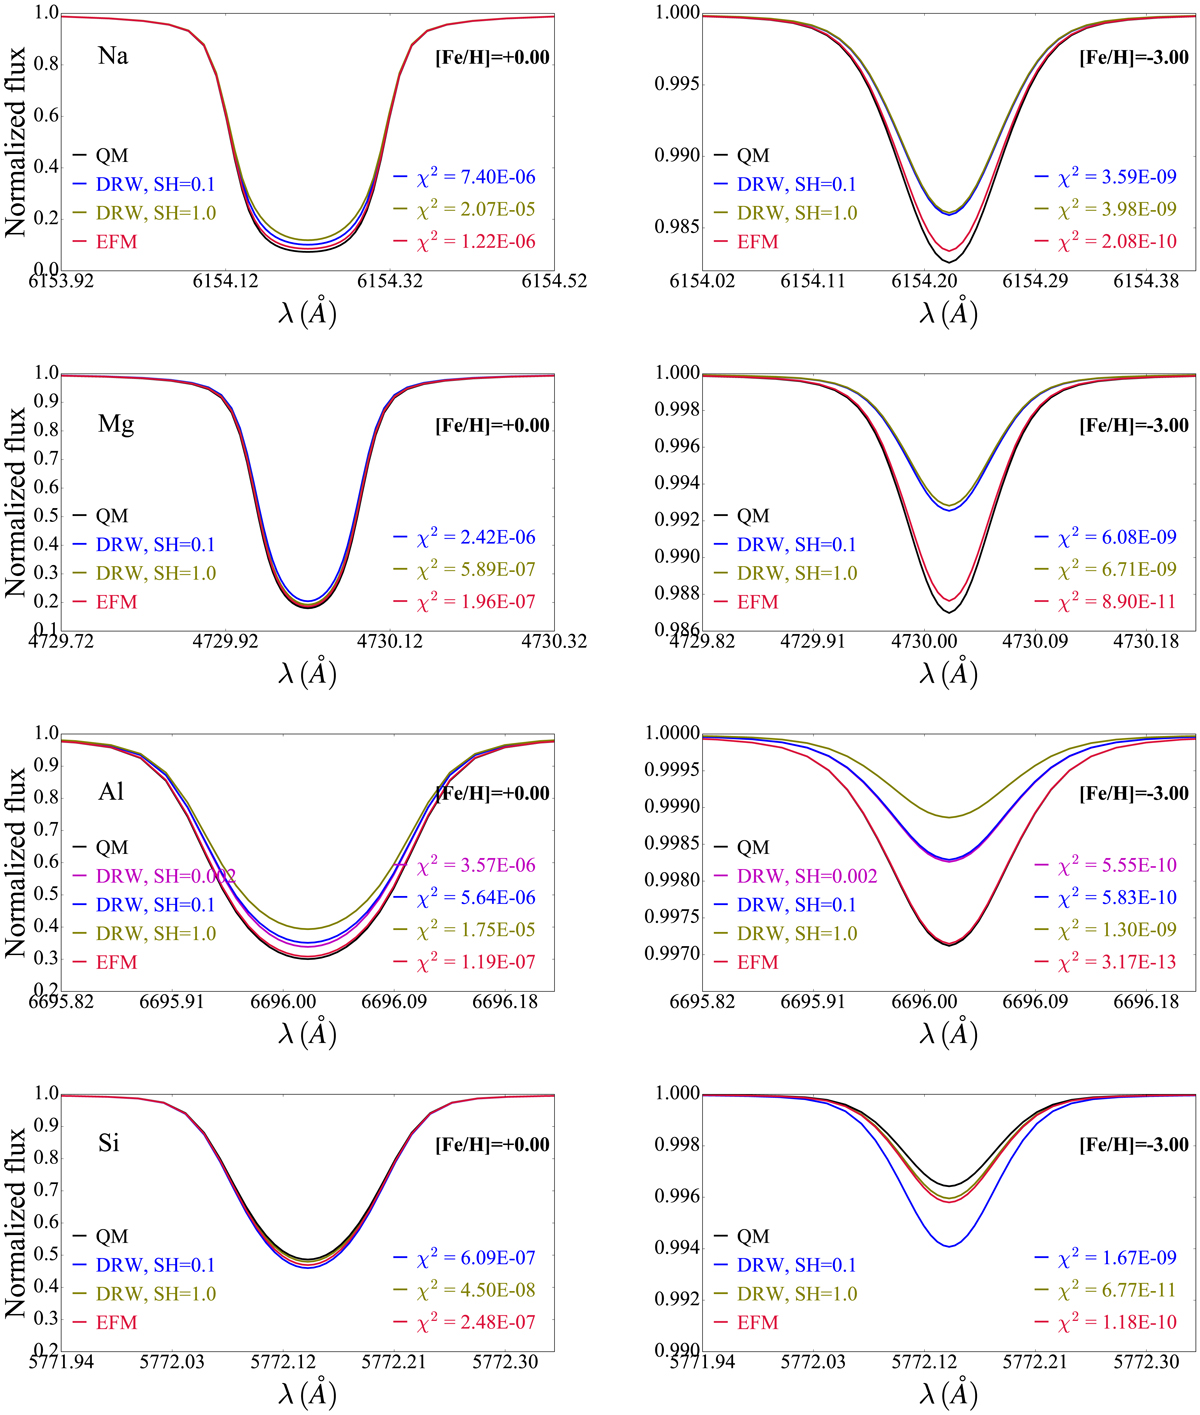
Line profiles of Na I 6154 Å, Mg I 4730 Å, Al I 6696 Å and Si I 5772 Å computed using different hydrogen collision models: QM (black lines), EFM (red lines), DRW, SH = 0.1 (blue lines), DRW, SH = 0.1 (olive lines) and DRW, SH = 0.002 for Al I (magenta lines). The lines were computed at Teff = 4500, log ɡ = 2.5 and for two metallicities, [Fe/H] = +0.00 (left panels) and [Fe/H] = −3.00 (right panels). The χ2 differences obtained between each model relative to the QM are shown on the plots.
Current usage metrics show cumulative count of Article Views (full-text article views including HTML views, PDF and ePub downloads, according to the available data) and Abstracts Views on Vision4Press platform.
Data correspond to usage on the plateform after 2015. The current usage metrics is available 48-96 hours after online publication and is updated daily on week days.
Initial download of the metrics may take a while.