Fig. 10.
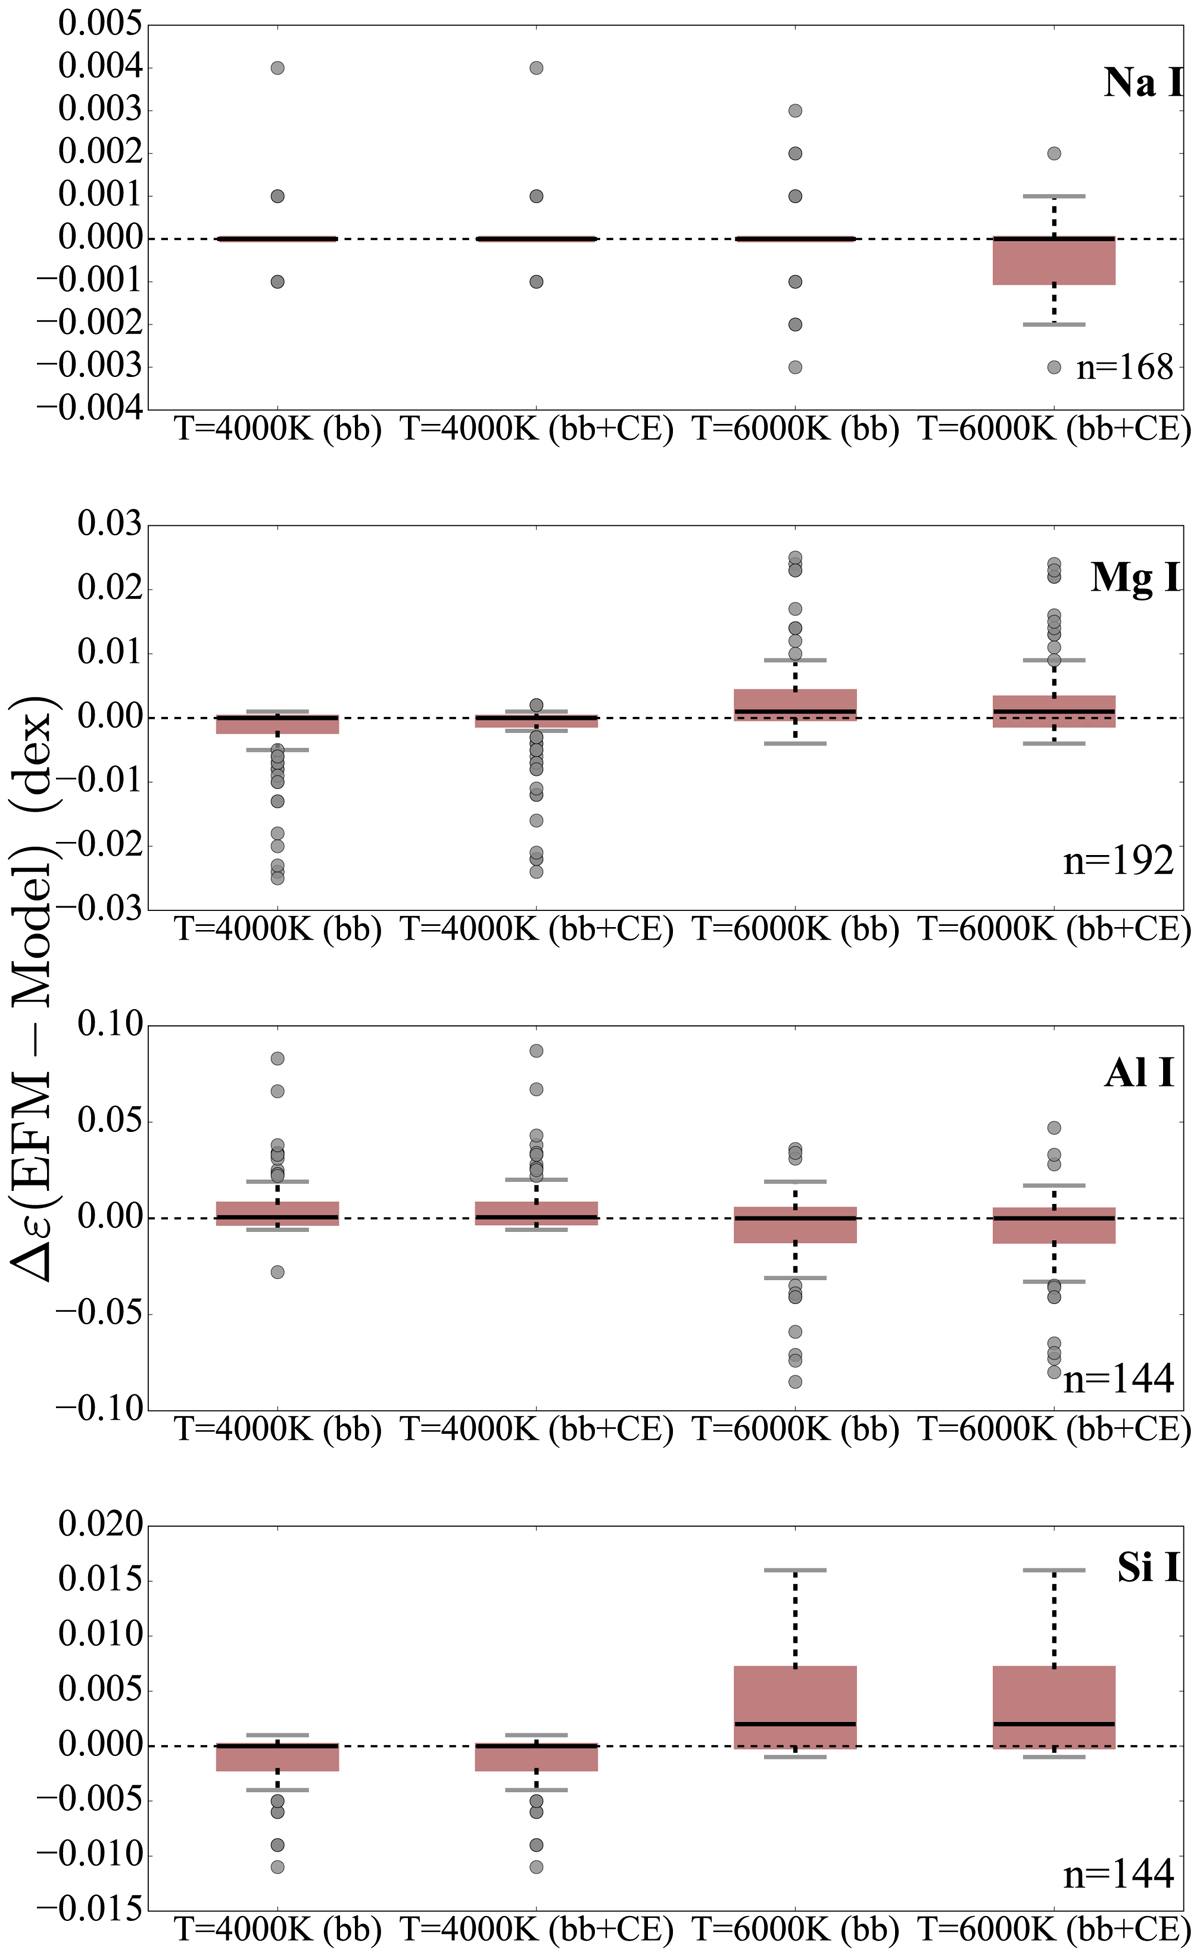
Box plots representing the NLTE abundance correction differences obtained between models computed with T-dependent EFM rates and those computed with T-independent EFM rates for either the bb or both bb+CE collisions at T = 4000 K and T = 6000 K, respectively. The different panels show the results obtained at each model considered for each of the Na I, Mg I, Al I and Si I representative lines (Tables A.1– A.4) at all considered stellar parameters (Table 3). The number of lines, n, used by each model is also displayed on the plots. The solid black lines in the boxes show the median differences obtained at each model for each atom. Colored boxes represent 50%, and whisker edges (dotted black lines) 90% of the lines. Gray circles show the remaining outlier lines
Current usage metrics show cumulative count of Article Views (full-text article views including HTML views, PDF and ePub downloads, according to the available data) and Abstracts Views on Vision4Press platform.
Data correspond to usage on the plateform after 2015. The current usage metrics is available 48-96 hours after online publication and is updated daily on week days.
Initial download of the metrics may take a while.