| Issue |
A&A
Volume 618, October 2018
|
|
|---|---|---|
| Article Number | C4 | |
| Number of page(s) | 1 | |
| Section | Cosmology (including clusters of galaxies) | |
| DOI | https://doi.org/10.1051/0004-6361/201629992e | |
| Published online | 11 October 2018 | |
Corrigendum
Statistical simulations of the dust foreground to cosmic microwave background polarization (Corrigendum)
1
Institut d'Astrophysique Spatiale, CNRS, Université Paris-Sud, Université Paris-Saclay,
Bât. 121,
91405
Orsay Cedex,
France
2
California Institute of Technology,
Pasadena,
CA
91125,
USA
3
Sorbonne Universités, UPMC Université Paris 6 et CNRS, UMR 7095, Institut d'Astrophysique de Paris, 98 bis bd Arago,
75014
Paris,
France
4
Sorbonne Universités, Institut Lagrange de Paris (ILP),
98 bis Boulevard Arago,
75014
Paris,
France
5
Laboratoire AIM, IRFU/Service d'Astrophysique, CEA/DSM, CNRS, Université Paris Diderot,
Bât. 709, CEA-Saclay,
91191
Gif-sur-Yvette Cedex,
France
6
LERMA, Observatoire de Paris, PSL Research University, CNRS, Sorbonne Universités, UPMC Université Paris 06, Ecole normale supérieure,
75005,
Paris,
France
7
CITA, University of Toronto,
60 St. George St.,
Toronto,
ON M5S 3H8,
Canada
8
CNRS, IRAP,
9 Av. Colonel Roche, BP 44346,
31028
Toulouse Cedex 4,
France
Key words: polarization / ISM: general / comic background radiation / submillimeter: ISM / errata, addenda
The caption of Fig. 8 had a confusing description of the material shown in the plots. The correct caption together with the figure is given below.
© ESO 2018
All Figures
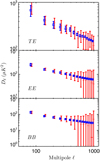 |
Fig. 8 High-resolution power spectra on the LR63 region; simulation vs. data. From top to bottom: TE, EE; and BB power spectra of the Planck 353 GHz, CMB-corrected maps (red crosses), and one high-resolution (Nside = 2048, FWHM = 10') realization of the model (blue squares). |
| In the text | |
Current usage metrics show cumulative count of Article Views (full-text article views including HTML views, PDF and ePub downloads, according to the available data) and Abstracts Views on Vision4Press platform.
Data correspond to usage on the plateform after 2015. The current usage metrics is available 48-96 hours after online publication and is updated daily on week days.
Initial download of the metrics may take a while.