| Issue |
A&A
Volume 617, September 2018
|
|
|---|---|---|
| Article Number | L5 | |
| Number of page(s) | 6 | |
| Section | Letters to the Editor | |
| DOI | https://doi.org/10.1051/0004-6361/201833980 | |
| Published online | 21 September 2018 | |
Letter to the Editor
Interplanetary dust delivery of water to the atmospheres of Pluto and Triton⋆
1
Space Sciences Laboratory, University of California at Berkeley, 7 Gauss Way, Berkeley, CA, USA
e-mail: This email address is being protected from spambots. You need JavaScript enabled to view it.
2
Dept. of Physics, University of Colorado at Boulder, Boulder, CO, USA
3
Laboratory for Atmospheric and Space Physics, University of Colorado at Boulder, Boulder, CO, USA
e-mail: This email address is being protected from spambots. You need JavaScript enabled to view it.
Received:
28
July
2018
Accepted:
19
August
2018
Abstract
Context. Both Pluto and Triton possess thin, N2-dominated atmospheres controlled by sublimation of surface ices.
Aims. We aim to constrain the influx and ablation of interplanetary dust grains into the atmospheres of both Pluto and Triton in order to estimate the rate at which oxygen-bearing species are introduced into both atmospheres.
Methods. We use (i) an interplanetary dust dynamics model to calculate the flux and velocity distributions of interplanetary dust grains relevant for both Pluto and Triton and (ii) a model for the ablation of interplanetary dust grains in the atmospheres of both Pluto and Triton. We sum the individual ablation profiles over the incoming mass and velocity distributions of interplanetary dust grains in order to determine the vertical structure and net deposition of water to both atmospheres.
Results. Our results show that <2% of silicate grains ablate at either Pluto or Triton while approximately 75% and >99% of water ice grains ablate at Pluto and Triton, respectively. From ice grains, we calculate net water influxes to Pluto and Triton of ~3.8 kg day−1 (8.5 × 10³ H2O cm−2 s−1) and ~370 kg day−1 (6.2 × 10⁵ H2O cm−2 s−1), respectively. The significant difference in total water deposition between Pluto and Triton is due to the presence of Triton within Neptune’s gravity well, which both enhances interplanetary dust particle (IDP) fluxes due to gravitational focusing and accelerates grains before entry into Triton’s atmosphere, thereby causing more efficient ablation.
Conclusions. We conclude that water deposition from dust ablation plays only a minor role at Pluto due to its relatively low flux. At Triton, water deposition from IDPs is more significant and may play a role in the alteration of atmospheric and ionospheric chemistry. We also suggest that meteoric smoke and smaller, unablated grains may serve as condensation nuclei for the formation of hazes at both worlds.
Key words: meteorites, meteors, meteoroids / Kuiper belt objects: individual: Pluto / planets and satellites: individual: Triton / planets and satellites: atmospheres / zodiacal dust
Data for Figs. 4 and 5 are only available at the CDS via anonymous ftp to cdsarc.u-strasbg.fr (130.79.128.5) or via http://cdsarc.u-strasbg.fr/viz-bin/qcat?J/A+A/617/L5
© ESO 2018
1. Introduction
Both Pluto and Triton possess thin, N2-dominated atmospheres controlled via vapor-pressure equilibrium with N2 ice on their surfaces. Pluto’s atmosphere was first detected in 1988 (Hubbard et al. 1988; Elliot et al. 1989), later repeatedly observed via stellar occultations (e.g., Elliot et al. 2003; Young et al. 2008; Lellouch et al. 2009; Rannou & Durry 2009; Olkin et al. 2015; Sicardy et al. 2016), and fully revealed by observations taken by the New Horizons spacecraft during its July 2015 fly-by of the Pluto-Charon system (Gladstone et al. 2016; Hinson et al. 2017; Young et al. 2018). Major findings from New Horizons regarding Pluto’s atmosphere include a much colder temperature structure of the atmosphere relative to pre-New Horizons models and expectations, relatively low atmospheric escape rates (due in part to the colder-than-anticipated atmosphere), and the presence of well-defined haze layers extending to several hundreds of kilometers in altitude (Gurwell et al. 2015; Gladstone et al. 2016; Lellouch et al. 2017; Cheng et al. 2017). Triton’s atmosphere was first observed during the Voyager 2 fly-by (e.g., Broadfoot 1989; Tyler et al. 1989; Pollack et al. 1990; Herbert & Sandel 1991; Krasnopolsky et al. 1993) and in comparison to Pluto, is somewhat colder (at least in the lower atmosphere) and thinner. Both atmospheres possess trace amounts of CO and CH4, the former of which plays an important role in the modification of the thermal structure (e.g., Krasnopolsky et al. 1993; Strobel et al. 1996; Elliot et al. 2000a; Zhu et al. 2014), photochemistry (Krasnopolsky & Cruikshank 1995; Krasnopolsky 2012), and ionosphere (e.g., Lellouch et al. 1992; Krasnopolsky et al. 1993; Strobel & Summers 1995) in both atmospheres.
The ablation of interplanetary dust particles (IDPs) has been shown to be a significant (if not always dominant) source of exogenous oxygen for the giant planet atmospheres (e.g., Feuchtgruber et al. 1997; Moses et al. 2000; Moses & Poppe 2017) and by analogy, has been previously theorized as an important source of oxygen-bearing species to the atmospheres of both Triton and Pluto (e.g., Krasnopolsky 2012; Strobel & Zhu 2017; Wong et al. 2017). Recent work has suggested that externally-sourced oxygen-bearing species (in particular, water) could be an important ingredient in Pluto’s atmosphere due to its role as a cooling agent (Strobel & Zhu 2017; Wong et al. 2017) as well as a precursor species for potentially other, as-of-yet undetected oxygen-bearing species (e.g., CO2, H2CO) (Wong et al. 2017). In contrast, Zhang et al. (2017) suggested that haze layers in Pluto’s atmosphere (Cheng et al. 2017), rather than water, may be responsible for the observed cooling. Furthermore, Krasnopolsky (2018) pointed out that the atmospheric models of Strobel & Zhu (2017) and Wong et al. (2017) employed water fluxes from IDPs to Pluto’s atmosphere that differ by nearly four orders of magnitude. Strobel & Zhu (2017) used 3.4 × 10¹⁹ H2O s−1 by adjusting the influx until the temperature structure in Pluto’s atmosphere matched that observed by New Horizons while Wong et al. (2017) used estimates of ~9 × 10²² H2O s−1 taken from the earlier dust model of Poppe (2015). Notwithstanding the differences inherent in these two models, what is clear is that a more accurate, independent assessment of the flux of water to Pluto’s atmosphere, and by comparison Triton’s atmosphere, is required in order to understand these unique atmospheres.
Here, we present calculations of the interplanetary dust flux and ablation of interplanetary dust grains within the atmospheres of Triton and Pluto. Section 2 presents the interplanetary dust environment at Triton and Pluto, respectively, as calculated from the model of Poppe (2016). Section 3 presents calculations of the ablation of interplanetary dust grains and calculates the total H2O deposition rates within each atmosphere. Finally, we discuss the implications and conclude in Sect. 4.
2. Interplanetary dust fluxes
Interplanetary dust grains are continuously generated throughout the solar system via mutual collisions, cometary outgassing, and interplanetary and interstellar dust grain bombardment (e.g., Stern 1995; Yamamoto & Mukai 1998; Nesvorný et al. 2010, 2011; Poppe 2015). In the inner solar system, dust grain production is dominated by outgassing from Jupiter-family comets with additional contributions from asteroidal collisions (Nesvorný et al. 2010); however, in the outer solar system, dust grain production arises from a mixture of cometary emission from Jupiter-family comets and Oort clouds comets as well as from Edgeworth–Kuiper belt objects (e.g., Kuchner & Stark 2010; Vitense et al. 2010, 2012; Poppe 2016). At the heliocentric distance of Pluto, only Edgeworth–Kuiper belt and Oort Cloud cometary grains contribute to the local IDP density. Figure 1a–d shows the azimuthally-averaged density distributions of 2 and 100 µm Edgeworth–Kuiper belt (EKB) and Oort Cloud cometary (OCC) grains as representative examples. EKB grain densities, shown in panels 1a and b, peak in the ecliptic plane near 40 au with generally decreasing extensions both radially and above and below the ecliptic plane. Due to longer Poynting-Robertson lifetimes, subsequent trapping in mean-motion resonances (e.g., Liou et al. 1996; Liou & Zook 1997, 1999), and collisional timescales that become increasingly shorter relative to transport timescales, larger grains are more concentrated near their birthplace than smaller grains. OCC grain densities, panels 1c and d, are approximately isotropic in inclination with peak densities at radially varying distances (~5 au for 2 µm grains and ~20–30 au for 100 µm) due to the so-called “Jupiter-barrier” (e.g., Fernández 1994; Levison et al. 2001). The projection of Pluto’s orbit is overlaid as the black curve on all four panels of Fig. 1 to show that the density of both EKB and OCC grains varies significantly over the course of Pluto’s orbital period (discussed further in Sect. 4). Taking into account gravitational focusing (e.g., Spahn et al. 2006), the mass fluxes of EKB and OCC grains to Pluto at the time of the New Horizons fly-by in 2015 are ~6 × 10⁻¹⁵ g m−2 s−1 and ~1 × 10⁻¹⁵ g m−2 s−1, respectively. At Triton, the fluxes of EKB and OCC grains are 5.6×10⁻¹³ and 5.0×10⁻¹⁵ g m−2 s−1, respectively. We note that these values are updated and believed to be more reliable than those presented in Poppe (2015), who utilized an earlier version of the interplanetary dust model at Pluto (see further discussion in Sect. 4). We neglect contributions from interstellar dust grains, which have relatively low mass fluxes on the order of 5 × 10⁻¹⁷ g m−2 s−1 (Grün et al. 1993, 1994; Altobelli et al. 2005, 2016), and planetary dust particles from Neptune’s ring system, which are located well within the orbit of Triton (e.g., Pedersen et al. 1991).
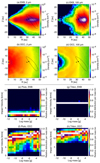 |
Fig. 1. Panels a–d: azimuthally-averaged dust grain densities for 2 and 100 µm EKB and OCC grains, as marked. The projection of Pluto’s orbit in the r−z plane is overlaid as the solid black curve and its position in 2015 as the black dot, where [r, z] = [0, 0] is the position of the Sun. The position of Triton and Neptune is denoted as the open circle. Panels e and f: the EKB and OCC dust grain velocity distributions at Pluto as a function of grain mass. Panels g and h: the EKB and OCC dust grain velocity distributions at Triton as a function of grain mass. Each mass bin is individually normalized. |
In addition to the IDP densities, the incoming velocity distributions of interplanetary dust grains are a key input for understanding ablation. To calculate the dust grain velocity distribution at the top of Pluto’s atmosphere, we extracted the three-dimensional dust grain velocity distribution at Pluto’s 2015 position, vectorially subtracted Pluto’s heliocentric velocity from the distribution, and finally, vectorially added Pluto’s gravitational escape velocity of 1.2 km s−1, which dust grains pick up as they are accelerated into Pluto’s gravity well. For Triton, we repeated a similar process by subtracting the Neptune-Triton heliocentric velocity and adding the speed gained from Neptune’s Hill radius to the orbital distance of Triton (~6.3 km s−1), Triton’s escape velocity (~1.5 km s−1), and Triton’s orbital velocity around Neptune (~4.4 km s−1) to the dust velocity distributions. We note that the orbital motion of Triton about Neptune will introduce further variability into the dust grain impact speed distribution (e.g., Pesnell et al. 2004); here, we assume that the IDPs strike Triton “head-on” for simplicity. Panels 1(e–h) show the velocity distributions of EKB and OCC dust grains as a function of grain mass between 10−12 and 10−3 g and grain velocity between 0 and 15 km s−1 for Pluto and Triton, respectively. Velocity distributions are normalized for each individual grain mass (i.e., each mass bin). At Pluto, EKB grain velocity distributions lie almost entirely between 1–3 km s−1 with little variation by size while OCC grains are typically faster, have broader distributions, and have a slight tendency to increase speed with size. Peak OCC grain velocities range between ~10–15 km s−1. At Triton, the EKB grains have nearly identical velocities between 7–8 km s−1 due to gravitational focusing and Triton’s orbital speed, while OCC grains have all been accelerated to at least the minimum ~7.5 km s−1 impact speed, yet still retain a broad speed distribution up to 15 km s−1.
3. IDP ablation in the atmospheres of Pluto and Triton
The ablation of dust grains along their entry into Pluto’s atmosphere is calculated using the ablation model of Hood & Horányi (1991), which tracks the altitude, speed, temperature, and mass of an incoming grain via a system of coupled differential equations (see Hood & Horányi 1991 for further details). This ablation model is somewhat simpler than other previous models (e.g., Kalashnikova et al. 2000), in that is does not continuously track evaporation based on the instantaneous vapor pressure of the grain. Thus, we may be missing some additional fraction of ablated material (mostly from silicate grains); however, given that (as we show below) nearly all water ice grains ablate anyway, we have most likely captured a large majority of the ablated mass. We studied two compositions for the incoming dust grains: silicate and water ice. Silicate grains have a material density of 2.5 g cm−3, melting and vaporization temperatures of 1630 and 1850 K (see e.g., Ahrens & O’Keefe 1972; Hood & Horányi 1991), respectively, specific heat of 0.7 × 10⁷ erg g−1 K−1, and latent heats of melting and vaporization of 4.5 × 10⁹ and 5 × 10⁹ erg g−1, respectively. Water ice grains have a material density of 1.0 g cm−3, vaporization temperature of 200 K at relevant pressures of 1–10 µbar, specific heat in the solid phase of 2×10⁷ erg g−1 K−1, and latent heat of vaporization of 5 × 10⁹ erg g−1. To model Pluto’s background atmosphere, we used the results of Strobel & Zhu (2017) which are fit to New Horizons measurements in the 2015 epoch (Gladstone et al. 2016; Hinson et al. 2017) and shown in Fig. 2. At this time in Pluto’s year, the surface atmospheric pressure reaches approximately 11 μbar. The model for Triton’s atmosphere is also taken from Strobel & Zhu (2017) and shown in Fig. 2, with a surface pressure from the Voyager epoch of approximately 14 μbar (although we note that observations made after the Voyager fly-by indicate a steady increase of Triton’s surface atmospheric pressure over time due to surface warming (e.g., Elliot et al. 1998, 2000b; Lellouch et al. 2010)).
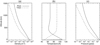 |
Fig. 2. Density, temperature, and pressure of the atmospheres of Pluto and Triton (Strobel & Zhu 2017). The model for Pluto is shown at the 2015 epoch. |
Figure 3 shows example results for the ablation of 200 μm dust grains with initial velocities at the top of Pluto’s atmosphere of 1, 2, 5, 10, 20, and 30 km s−1, respectively, for two different compositions: (a and b) silicate and (c and d) water ice. Upon entry into Pluto’s atmosphere, all silicate grains are decelerated and heated, with maximum temperatures occurring at altitudes of approximately 100–150 km; however, only the 20 km s−1 and 30 km s−1 grains passed the silicate melting and vaporization points and fully ablated. All other grains eventually cooled and impacted Pluto’s surface at velocities of 1 km s−1 or less. By testing additional initial speeds, we found that silicate grains must have initial velocities of approximately 13 km s−1 or greater in order to ablate. Inspection of the velocity distributions at both Pluto and Triton in Figs. 1e–h show that some fraction of silicate grains at the higher tail of the Oort Cloud cometary velocity distribution may ablate at Pluto and Triton (assuming that the silicate ablation curves in Triton’s atmosphere are reasonably similar to those presented here for Pluto). Icy grains, whose ablation curves are shown in Figs. 3c and d, are much more efficiently lost in Pluto’s atmosphere. All but the slowest (1 km s−1) grain reached the ice vaporization point of 200 K and ablated into Pluto’s atmosphere. Ablation heights range from 0 km (grains with initial speeds in between 1 km s−1 and 2 km s−1 should ablate all the way down to the surface) to approximately 550 km. Inspection of the IDP velocity distributions in Fig. 1 suggests that significant, if not complete, ablation of water ice grains should occur at both Pluto and Triton.
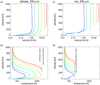 |
Fig. 3. Velocity and temperature of 200 μm (panels a and b) silicate and (panels c and d) icy grains in Pluto’s atmosphere from the ablation model. Colored lines correspond to different initial speeds. |
With these example ablation runs in hand, we chose to neglect any deposition of oxygen from the silicate grains as (1) the overall fraction of ablated silicate grains is low compared to water ice due to the relatively high minimum velocity required for ablation and (2) as discussed in previous ablation models (e.g., Moses & Poppe 2017), the oxygen ablated from silicate grains is likely lost from the parent grain as silicate vapor (e.g., SiO) (see also, Table III, Ahrens & O’Keefe 1972). Thus, focusing solely on water ice grains, which we assume to comprise approximately 40% of the total dust mass (Greenberg & Li 1999; Moses & Poppe 2017), we calculated the full ablation profiles and mass deposition for IDP grains entering the atmospheres of both Pluto and Triton. We used a Monte Carlo-type approach, whereby we generated random initial masses (10−12 < m < 10−3 g) and velocities (1 < v < 15 km s−1) and assigned a relative weight for each modeled grain ablation curve based on the IDP mass and velocity distributions. For each object (Pluto, Triton) and for each dust family (EKB, OCC), we ran a total of 100 000 grains and ensured that the sum over all Monte Carlo grains matched the total mass flux.
Figure 4 shows the mass deposition profile as a function of altitude, separated by object and dust family. At Pluto, IDP ablation occurs in two separate peaks: OCC grains at altitudes between 250–600 km and EKB grains between 50–400 km. The higher velocities of OCC grains cause faster heating, more rapid ablation, and deposition at higher altitudes than the slower EKB grains. Peak mass deposition rates are approximately 7 × 10⁻⁵ g s−1 km−1 and 2 × 10⁻⁴ g s−1 km−1 for OCC and EKB grains, respectively. Approximately 55% of the incoming EKB water ice grain mass flux ablates while approximately 95% of the OCC water ice grain mass flux ablates; unablated grains settle to the surface without substantial mass loss. At Triton, the mass deposition occurs in a more concentrated region between 80–400 km and at higher overall rates, with peak values at approximately 4 × 10⁻⁴ g s−1 km−1 and 3 × 10⁻² g s−1 km−1 for OCC and EKB grains, respectively. Ablation efficiencies for EKB and OCC grains at Triton are both >99%. For OCC grains at Triton (green dashed curve), we note the double-peaked structure. The lower peak near 120 km is the location where the dominant mass influx ablates while the upper peak near 300 km is due to the presence of slower, small grains (see Fig. 1h) that tend to ablate at a lower altitude than their faster counterparts and thus, increase the local ablation rate near 300 km. The differences at Triton with respect to Pluto are attributable to the presence of Triton within Neptune’s gravity well, which both accelerates grains (thereby causing more effective ablation) and gravitationally enhances the flux of both populations (Spahn et al. 2006). In total, IDP grains contribute only 3.8 kg day−1 (1.5 × 10²¹ equivalent H2O s−1 or a flux of 8.5 × 10³ H2O cm−2 s−1 for a surface radius of 1187 km) to Pluto’s atmosphere, yet in comparison, contribute approximately 370 kg day−1 (1.4 × 10²³ equivalent H2O s−1 or a flux of 6.2 × 10⁵ H2O cm−2 s−1 for a surface radius of 1353 km) to Triton’s atmosphere.
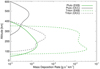 |
Fig. 4. Ablated mass deposition rate for water ice grains as a function of altitude for both Pluto (solid lines) and Triton (dashed lines) for EKB (green) and OCC (black) grains, respectively. |
4. Discussion and conclusion
Due to a historical lack of in-situ measurements, the fluxes of interplanetary dust grains and the subsequent introduction of exogenous species to the atmospheres in the outer solar system have long been uncertain. Nevertheless, recent in-situ dust measurements by the New Horizons Student Dust Counter (Horányi et al. 2008; Poppe et al. 2010; Szalay et al. 2013) and associated modeling (Poppe 2016) have significantly improved our understanding. With regards to the IDP mass flux to Pluto published in Poppe (2015), our results here are nearly an order of magnitude lower. The main reason for this is the introduction of collisional grinding of EKB dust grains as described in Poppe (2016), which reduces the overall mass flux of IDPs in the outer solar system, especially for larger grain sizes (see also Stark & Kuchner 2009; Kuchner & Stark 2010). This loss of mass flux is particularly tied to the assumption that collisional fragments are rapidly lost from the solar system due to radiation pressure, that is, they become β-meteoroids (Grün & Zook 1980; Wehry & Mann 1999). If the interplanetary dust grain model relaxed this particular assumption and modeled the production of collisional fragments (see, for example, Sect. 4, Stark & Kuchner 2009), we may find a somewhat higher mass flux predicted for Pluto. Despite this, Kuchner & Stark (2010) presented arguments that the loosely-bound, aggregate nature of cometary and presumably EKB grains would cause efficient production of sub-micrometer grains upon grain-grain collisions that are then efficiently lost from the solar system. Such an argument is in fact bolstered by more recent observations from the Rosetta spacecraft, which showed that grains from 67P/Churyumov-Gerasimenko are hierarchical aggregates of sub-micron grains and thus, would indeed be easily shattered upon collision (Bentley et al. 2016). Thus, we feel relatively confident in our assumption of rapid loss of any collisional IDP fragments.
At Triton, the meteoroidal water influx calculated here, 1.4 × 10²³ equivalent H2O s−1 or 370 kg day−1, is significantly higher than at Pluto due to gravitational acceleration and focusing of interplanetary dust grains by Neptune’s gravity well, and thus, should play a more prominent role in the atmospheric and ionospheric structure and chemistry at Triton. Krasnopolsky (2012) assumed a water influx of ~5 × 10²³ s−1 based on the observations of Feuchtgruber et al. (1997) at Neptune, similar to our calculations here. Interestingly, we suggest that Triton’s atmosphere may actually serve as an important observational data point for constraining the total influx of IDPs at 30 au. While oxygen-bearing species have been detected in Neptune’s atmosphere (e.g., Rosenqvist et al. 1992; Marten et al. 1993; Feuchtgruber et al. 1997), it is now generally accepted that a significant fraction of the observed CO at Neptune is due to a major cometary impact (e.g., Lellouch et al. 2005; Hesman et al. 2007; Luszcz-Cook & de Pater 2013; Moses & Poppe 2017), thereby complicating the interpretation of the role of IDP influx. In contrast, Triton is much less likely to have suffered such a cometary impact (nor would the effects of a cometary impact persist such as they do in Neptune’s atmosphere) and thus, represents an “uncontaminated” atmosphere with which to constrain the abundance and ultimate origin of oxygen-bearing species (e.g., H2O, CO2, H2CO, etc.) from interplanetary dust grains in the outer solar system.
At Pluto, the flux of water molecules, 1.5 × 10²¹ H2O s−1 or 3.8 kg day−1, falls in between the values either assumed or inferred by previous models (e.g., Krasnopolsky 2012; Strobel & Zhu 2017; Wong et al. 2017). Our H2O flux is higher than that required by Strobel & Zhu (2017) to fit the Pluto atmospheric temperature profile via H2O rotational cooling, yet Krasnopolsky (2018) point out that the photochemical loss of H2O, which was neglected in Strobel & Zhu (2017), should be much more efficient than the condensation loss of H2O. Furthermore, Zhang et al. (2017) present compelling evidence that Pluto’s haze layers are responsible for the cold atmospheric structure of Pluto as opposed to water. Our relatively reduced rates of water influx with respect to the Poppe (2015) calculations and the loss of any H2O present via photolysis provide further argument that water is present in insufficient quantities to serve a role as a primary cooling agent at Pluto. Meanwhile, Wong et al. (2017) predicted the concentrations of oxygen bearing species at Pluto using an influx of ~9 × 10²² H2O s−1, almost two orders of magnitude larger than our calculations. Thus, one would expect the predicted concentrations of H2O, CO2, and H2CO to be similarly reduced from the Wong et al. (2017) results, making their detection via remote-sensing all the more challenging.
While not explored in depth here, we do note that the partial ablation of silicate grains at both Pluto and Triton may have consequences for the atmospheric and ionospheric chemistry and structure at both objects. As discussed by Pesnell et al. (2004), metals ablated from silicate grains could play a role in the formation of low-altitude ionospheric layers below the main ionospheric peak observed at Triton (Tyler et al. 1989), while neutral, recondensed vapor may play a role as condensation nuclei in the formation of haze layers (e.g., Yelle et al. 1995). It is also potentially the case that recondensed meteoric smoke participates in the formation of haze layers at Pluto (in analogy to studies showing a similar possible effect at Titan; Frankland et al. 2016), although Gao et al. (2017) have recently modeled the formation of Pluto’s haze layers via nucleation on photochemically-derived aggregates, without the need for meteoric condensation nuclei. Nevertheless, a detailed assessment of the behavior of recondensed meteoric smoke in the atmospheres of both Triton and Pluto with regards to haze formation may shed additional light on the New Horizons haze observations.
Finally, we also point out the variability of both Pluto’s atmosphere and the interplanetary dust grain mass flux to Pluto. Figure 5 shows the interplanetary dust grain mass flux, Pluto’s surface atmospheric pressure from the models of Bertrand & Forget (2017), and Pluto’s heliocentric distance as a function of time over one Pluto year. Due to Pluto’s eccentric (e = 0.249) and inclined (i = 17.16°) orbit, it traverses through different regions of the interplanetary dust density as shown in Figs. 1a–d. EKB fluxes vary over two orders of magnitude at Pluto as seen in Fig. 5a, with peaks centered at points where Pluto crosses the ecliptic plane (~2019 and ~2175) while OCC grains vary over a factor of approximately four. As shown in Bertrand & Forget (2017), Pluto’s atmospheric pressure varies by an order of magnitude from its present-day, near-maximum value of ~12 μbar down to a minimum of ~1 μbar. Thus, the ablation efficiency and total water deposition rates from interplanetary dust grains at Pluto calculated here happen to be near their maximum value. The detection of atmospheric species dependent in part on the influx of IDP grains (e.g., H2O, CO2, H2CO; Krasnopolsky 2012; Wong et al. 2017) may only become more difficult in the future (at least until Pluto completes another orbit about 250 years from now).
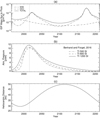 |
Fig. 5. Panel a: interplanetary dust mass flux to Pluto for both EKB and OCC grains. Panel b: the surface atmospheric pressure of three different cases of surface thermal inertia from Bertrand & Forget (2016). Panel c: the heliocentric distance of Pluto. The vertical dashed line in all three panels denotes the time of the New Horizons fly-by. |
Acknowledgments
A.R.P. gratefully acknowledges support from NASA’s Solar System Exploration Research Virtual Institute (SSERVI) grant #NNX14AG16A. M. H. was supported by the NASA New Horizons mission. The authors thank D. Strobel for providing the atmospheric model results for Pluto and Triton and T. Bertrand and F. Forget for supplying time-variable atmospheric model results for Pluto. The authors also thank the reviewer for helpful and constructive comments.
References
- Ahrens, T. J., & O’Keefe, J. D. 1972, The Moon, 4, 214 [NASA ADS] [CrossRef] [Google Scholar]
- Altobelli, N., Kempf, S., Krüger, H., et al. 2005, J. Geophys. Res., 110, 7102 [NASA ADS] [CrossRef] [Google Scholar]
- Altobelli, N., Postberg, F., Fiege, K., et al. 2016, Science, 352, 312 [NASA ADS] [CrossRef] [Google Scholar]
- Bentley, M. S., Schmied, R., Mannel, T., et al. 2016, Nature, 537, 73 [NASA ADS] [CrossRef] [Google Scholar]
- Bertrand, T., & Forget, F. 2016, Nature, 540, 86 [NASA ADS] [CrossRef] [Google Scholar]
- Bertrand, T., & Forget, F. 2017, Icarus, 287, 72 [NASA ADS] [CrossRef] [Google Scholar]
- Broadfoot, A. L., Atreya, S. K., Bertaux, J. L., et al. 1989, Science, 246, 1459 [NASA ADS] [CrossRef] [PubMed] [Google Scholar]
- Cheng, A. F., Summers, M. E., Gladstone, G. R., et al. 2017, Icarus, 290, 112 [CrossRef] [Google Scholar]
- Elliot, J. L., Dunham, E. W., Bosh, A. S., et al. 1989, Icarus, 77, 148 [NASA ADS] [CrossRef] [Google Scholar]
- Elliot, J. L., Hammel, H. B., Wasserman, L. H., et al. 1998, Nature, 393, 765 [NASA ADS] [CrossRef] [Google Scholar]
- Elliot, J. L., Strobel, D. F., Zhu, X., et al. 2000a, Icarus, 143, 425 [NASA ADS] [CrossRef] [Google Scholar]
- Elliot, J. L., Person, M. J., McDonald, S. W., et al. 2000b, Icarus, 148, 347 [NASA ADS] [CrossRef] [Google Scholar]
- Elliot, J. L., Ates, A., Babcock, B. A., et al. 2003, Nature, 424, 165 [NASA ADS] [CrossRef] [PubMed] [Google Scholar]
- Fernández, J. A. 1994, in Asteroids, Comets, Meteors, ed. A. Milani (IAU), 223 [Google Scholar]
- Feuchtgruber, H., Lellouch, E., de Graauw, T., et al. 1997, Nature, 389, 159 [NASA ADS] [CrossRef] [PubMed] [Google Scholar]
- Frankland, V. L., James, A. D., Carrillo-Sánchez, J. D., et al. 2016, Icarus, 278, 88 [NASA ADS] [CrossRef] [Google Scholar]
- Gao, P., Fan, S., Wong, M. L., et al. 2017, Icarus, 287, 116 [NASA ADS] [CrossRef] [Google Scholar]
- Gladstone, G. R., Stern, S. A., Ennico, K., et al. 2016, Science, 351, 8866 [Google Scholar]
- Greenberg, J. M., & Li, A. 1999, Space Sci. Rev., 90, 149 [NASA ADS] [CrossRef] [Google Scholar]
- Grün, E., & Zook, H.A. 1980, in Solid Particles in the Solar System, eds. I. Halliday, & B. A. McIntosh (Cambridge Univ. Press), IAU Symp., 90, 293 [NASA ADS] [Google Scholar]
- Grün, E., Zook, H. A., Baguhl, M., et al. 1993, Nature, 362, 428 [NASA ADS] [CrossRef] [Google Scholar]
- Grün, E., Gustafson, B., Mann, I., et al. 1994, A&A, 286, 915 [NASA ADS] [Google Scholar]
- Gurwell, M., Lellouch, E., & Butler, B., et al. 2015, in AAS/Division for Planetary Sciences Meeting Abstracts, 47 [Google Scholar]
- Herbert, F., & Sandel, B. R. 1991, J. Geophys. Res., 96, 19241 [NASA ADS] [CrossRef] [Google Scholar]
- Hesman, B. E., Davis, G. R., Matthews, H. E., & Orton, G. S. 2007, Icarus, 186, 342 [NASA ADS] [CrossRef] [Google Scholar]
- Hinson, D. P., Linscott, I. R., Young, L. A., et al. 2017, Icarus, 290, 96 [CrossRef] [Google Scholar]
- Hood, L. L., & Horányi, M. 1991, Icarus, 93, 259 [NASA ADS] [CrossRef] [Google Scholar]
- Horányi, M., Hoxie, V., James, D., et al. 2008, Space Sci. Rev., 140, 387 [NASA ADS] [CrossRef] [Google Scholar]
- Hubbard, W. B., Hunten, D. M., Dieters, S. W., Hill, K. M., & Watson, R. D. 1988, Nature, 336, 452 [NASA ADS] [CrossRef] [EDP Sciences] [Google Scholar]
- Kalashnikova, O., Horányi, M., Thomas, G. E., & Toon, O. B. 2000, Geophys. Res. Lett., 27, 3293 [NASA ADS] [CrossRef] [Google Scholar]
- Krasnopolsky, V. A. 2012, Planet. Space Sci., 73, 318 [NASA ADS] [CrossRef] [Google Scholar]
- Krasnopolsky, V. A. 2018, Icarus, 301, 152 [NASA ADS] [CrossRef] [Google Scholar]
- Krasnopolsky, V. A., & Cruikshank, D. P. 1995, J. Geophys. Res., 100, 21271 [NASA ADS] [CrossRef] [Google Scholar]
- Krasnopolsky, V. A., Sandel, B. R., Herbert, F., & Vervack, R. J. 1993, J. Geophys. Res., 98, 3065 [NASA ADS] [CrossRef] [Google Scholar]
- Kuchner, M. J., & Stark, C. C. 2010, AJ, 140, 1007 [NASA ADS] [CrossRef] [Google Scholar]
- Lellouch, E., Blanc, M., Oukbir, J., & Longaretti, P.-Y. 1992, Adv. Space Res., 12, 113 [NASA ADS] [CrossRef] [Google Scholar]
- Lellouch, E., Moreno, R., & Paubert, G. 2005, A&A, 430, L37 [NASA ADS] [CrossRef] [EDP Sciences] [Google Scholar]
- Lellouch, E., Sicardy, B., de Bergh, C., et al. 2009, A&A, 495, L17 [NASA ADS] [CrossRef] [EDP Sciences] [Google Scholar]
- Lellouch, E., de Bergh, C., Sicardy, B., et al. 2010, A&A, 512, L8 [NASA ADS] [CrossRef] [EDP Sciences] [Google Scholar]
- Lellouch, E., Gurwell, M., Butler, B., et al. 2017, Icarus, 286, 289 [NASA ADS] [CrossRef] [Google Scholar]
- Levison, H. F., Dones, L., & Duncan, M. J. 2001, AJ, 121, 2253 [NASA ADS] [CrossRef] [Google Scholar]
- Liou, J.-C., & Zook, H. A. 1997, Icarus, 128, 354 [NASA ADS] [CrossRef] [Google Scholar]
- Liou, J.-C., & Zook, H. A. 1999, AJ, 118, 580 [NASA ADS] [CrossRef] [Google Scholar]
- Liou, J.-C., Zook, H. A., & Dermott, S. F. 1996, Icarus, 124, 429 [NASA ADS] [CrossRef] [Google Scholar]
- Luszcz-Cook, S. H., & de Pater, I. 2013, Icarus, 222, 379 [NASA ADS] [CrossRef] [Google Scholar]
- Marten, A., Gautier, D., Owen, T., et al. 1993, ApJ, 406, 285 [NASA ADS] [CrossRef] [Google Scholar]
- Moses, J. I., & Poppe, A. R. 2017, Icarus, 297, 33 [NASA ADS] [CrossRef] [Google Scholar]
- Moses, J. I., Lellouch, E., Bézard, B., et al. 2000, Icarus, 145, 166 [NASA ADS] [CrossRef] [Google Scholar]
- Nesvorný, D., Jenniskens, P., Levison, H. F., et al. 2010, ApJ, 713, 816 [NASA ADS] [CrossRef] [Google Scholar]
- Nesvorný, D., Vokrouhlický, D., Pokorný, P., & Janches, D. 2011, ApJ, 743 [Google Scholar]
- Olkin, C. B., Young, L. A., Borncamp, D., et al. 2015, Icarus, 246, 220 [Google Scholar]
- Pedersen, B. M., Meyer-Vernet, N., Aubier, M. G., & Zarka, P. 1991, J. Geophys. Res., 96, 19187 [NASA ADS] [CrossRef] [Google Scholar]
- Pesnell, W. D., Grebowsky, J. M., & Weisman, A. L. 2004, Icarus, 169, 482 [NASA ADS] [CrossRef] [Google Scholar]
- Pollack, J. B., Schwartz, J. M., & Rages, K. 1990, Science, 250, 440 [NASA ADS] [CrossRef] [Google Scholar]
- Poppe, A. R. 2015, Icarus, 246, 352 [NASA ADS] [CrossRef] [Google Scholar]
- Poppe, A. R. 2016, Icarus, 264, 369 [NASA ADS] [CrossRef] [Google Scholar]
- Poppe, A., James, D., Jacobsmeyer, B., & Horányi, M. 2010, Geophys. Lett. Res., 37, L11101 [Google Scholar]
- Rannou, P., & Durry, G. 2009, J. Geophys. Res., 114 [Google Scholar]
- Rosenqvist, J., Lellouch, E., Romani, P. N., Paubert, G., & Encrenaz, T. 1992, ApJ, 392, L99 [NASA ADS] [CrossRef] [Google Scholar]
- Sicardy, B., Talbot, J., Meza, E., et al. 2016, ApJ, 819, L38 [NASA ADS] [CrossRef] [Google Scholar]
- Spahn, F., Schmidt, J., Albers, N., et al. 2006, Science, 311, 1416 [NASA ADS] [CrossRef] [Google Scholar]
- Stark, C. C., & Kuc´hner, M. J. 2009, ApJ, 707, 543 [NASA ADS] [CrossRef] [Google Scholar]
- Stern, S. A., 1995, AJ, 110, 856 [NASA ADS] [CrossRef] [Google Scholar]
- Strobel, D. F., & Summers, M. E. 1995, in Neptune and Triton, eds. D. P. Cruikshank, M. S. Matthews, & A. M. Schumann, 1107 [Google Scholar]
- Strobel, D. F., & Zhu, X. 2017, Icarus, 291, 55 [NASA ADS] [CrossRef] [Google Scholar]
- Strobel, D. F., Zhu, X., Summers, M. E., & Stevens, M. H. 1996, Icarus, 120, 266 [NASA ADS] [CrossRef] [Google Scholar]
- Szalay, J. R., Piquette, M., & Horányi, M. 2013, Earth Planets Space, 65, 1145 [NASA ADS] [CrossRef] [Google Scholar]
- Tyler, G. L., Sweetnam, D. N., Anderson, J. D., et al. 1989, Science, 246, 1466 [NASA ADS] [CrossRef] [Google Scholar]
- Vitense, C., Krivov, A. V., & Löhne, T. 2010, A&A, 520, A32 [NASA ADS] [CrossRef] [EDP Sciences] [Google Scholar]
- Vitense, C., Krivov, A. V., Kobayashi, H., & Löhne, T. 2012, A&A, 540, A30 [NASA ADS] [CrossRef] [EDP Sciences] [Google Scholar]
- Wehry, A., & Mann, I. 1999, A&A, 341, 296 [NASA ADS] [Google Scholar]
- Wong, M. L., Fan, S., Gao, P., et al. 2017, Icarus, 287, 110 [NASA ADS] [CrossRef] [Google Scholar]
- Yamamoto, S., & Mukai, T. 1998, A&A, 329, 785 [NASA ADS] [Google Scholar]
- Yelle, R. V., Lunine, J. I., Pollack, J. B., & Brown, R. H. 1995, in Neptune and Triton, eds. D. P. Cruikshank, M. S. Matthews, A. M. Schumann (Tuscon: Univ. of Arizona Press), 1031 [Google Scholar]
- Young, L. A., Stern, S. A., Weaver, H. A., et al. 2008, Space Sci. Rev., 140, 93 [NASA ADS] [CrossRef] [Google Scholar]
- Young, L. A., Kammer, J. A., Steffl, A. J., et al. 2018, Icarus, 300, 174 [NASA ADS] [CrossRef] [Google Scholar]
- Zhang, X., Strobel, D. F., & Imanaka, H. 2017, Nature, 551, 352 [NASA ADS] [CrossRef] [Google Scholar]
- Zhu, X., Strobel, D. F., & Erwin, J. T. 2014, Icarus, 228, 301 [NASA ADS] [CrossRef] [Google Scholar]
All Figures
|
Fig. 1. Panels a–d: azimuthally-averaged dust grain densities for 2 and 100 µm EKB and OCC grains, as marked. The projection of Pluto’s orbit in the r−z plane is overlaid as the solid black curve and its position in 2015 as the black dot, where [r, z] = [0, 0] is the position of the Sun. The position of Triton and Neptune is denoted as the open circle. Panels e and f: the EKB and OCC dust grain velocity distributions at Pluto as a function of grain mass. Panels g and h: the EKB and OCC dust grain velocity distributions at Triton as a function of grain mass. Each mass bin is individually normalized. |
| In the text | |
|
Fig. 2. Density, temperature, and pressure of the atmospheres of Pluto and Triton (Strobel & Zhu 2017). The model for Pluto is shown at the 2015 epoch. |
| In the text | |
|
Fig. 3. Velocity and temperature of 200 μm (panels a and b) silicate and (panels c and d) icy grains in Pluto’s atmosphere from the ablation model. Colored lines correspond to different initial speeds. |
| In the text | |
|
Fig. 4. Ablated mass deposition rate for water ice grains as a function of altitude for both Pluto (solid lines) and Triton (dashed lines) for EKB (green) and OCC (black) grains, respectively. |
| In the text | |
|
Fig. 5. Panel a: interplanetary dust mass flux to Pluto for both EKB and OCC grains. Panel b: the surface atmospheric pressure of three different cases of surface thermal inertia from Bertrand & Forget (2016). Panel c: the heliocentric distance of Pluto. The vertical dashed line in all three panels denotes the time of the New Horizons fly-by. |
| In the text | |
Current usage metrics show cumulative count of Article Views (full-text article views including HTML views, PDF and ePub downloads, according to the available data) and Abstracts Views on Vision4Press platform.
Data correspond to usage on the plateform after 2015. The current usage metrics is available 48-96 hours after online publication and is updated daily on week days.
Initial download of the metrics may take a while.