Fig. 1
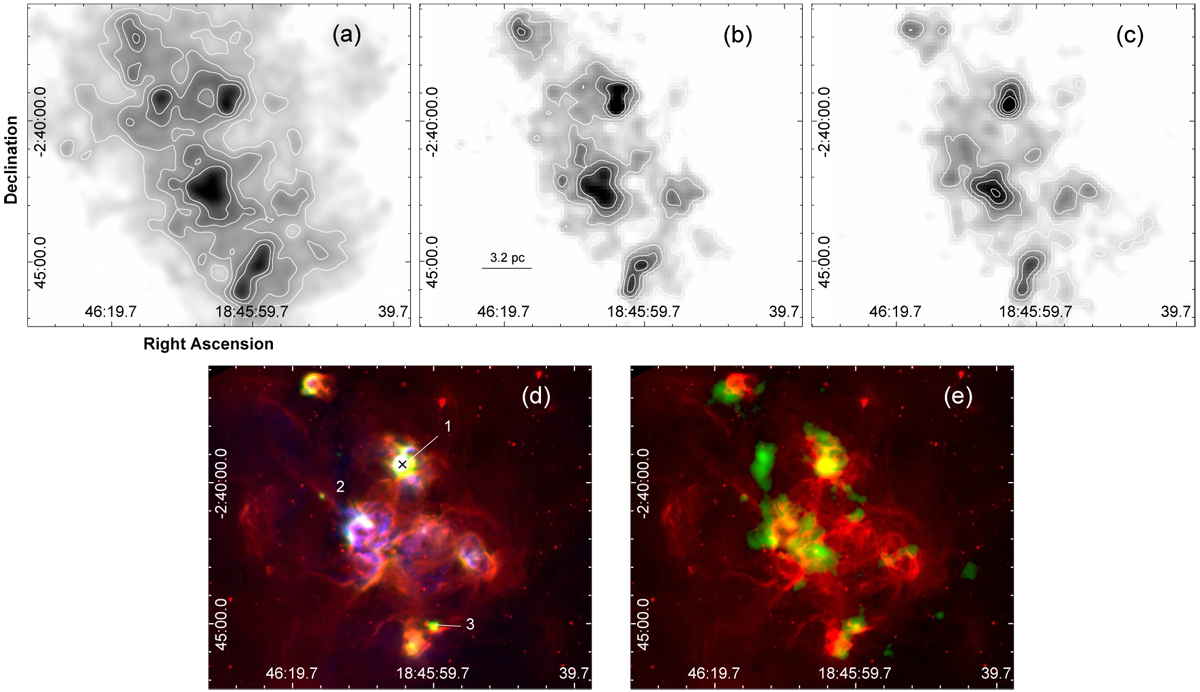
Panel a: 12CO J = 3–2 line integrated between 80 and 120 km s−1, the contour levels are 130, 160, 196, 230, and 262 K km s−1. Panel b: 13CO J = 3–2 line integrated between 90 and 110 km s−1, the contour levels are 27, 41, 55, and 72 K km s−1. Panel c: C18O J = 3–2 line integrated between 90 and 110 km s−1 with contour levels of 5, 11, 16, 22, and 27 K km s−1. Panel d: three-color image toward G29.96−0.02 displaying the Spitzer-IRAC 8 μm emission in red, the Herschel-PACS 70 μm emission in green, and the radio continuum emission at 20 cm as extracted from the MAGPIS in blue. The numbers indicate the positions of some features described in the text. The black cross indicates the position of the known O-type star (Watson & Hanson 1997). Panel e: two-color image of the G29.96−0.02 region showing Spitzer-IRAC 8 μm emission in red and the emission at 850 μm obtained from SCUBA in green.
Current usage metrics show cumulative count of Article Views (full-text article views including HTML views, PDF and ePub downloads, according to the available data) and Abstracts Views on Vision4Press platform.
Data correspond to usage on the plateform after 2015. The current usage metrics is available 48-96 hours after online publication and is updated daily on week days.
Initial download of the metrics may take a while.